
Compare Good Times Restaurants, Inc. with Similar Stocks
Dashboard
1
- OPERATING CASH FLOW(Y) Lowest at USD 1.84 MM
- NET PROFIT(HY) At USD 1.36 MM has Grown at -33.51%
- INTEREST(HY) At USD 0.11 MM has Grown at 55.07%
2
With ROE of 7.66%, it has a expensive valuation with a 0.63 Price to Book Value
3
Consistent Underperformance against the benchmark over the last 3 years
Total Returns (Price + Dividend) 
TimePeriod
Price Return
Dividend Return
Total Return
3 Months
-50.61%
0%
-50.61%
6 Months
-54.98%
0%
-54.98%
1 Year
-50.41%
0%
-50.41%
2 Years
-58.08%
0%
-58.08%
3 Years
-58.73%
0%
-58.73%
4 Years
-70.39%
0%
-70.39%
5 Years
1.67%
0%
1.67%
Good Times Restaurants, Inc. for the last several years.
Risk Adjusted Returns v/s
News
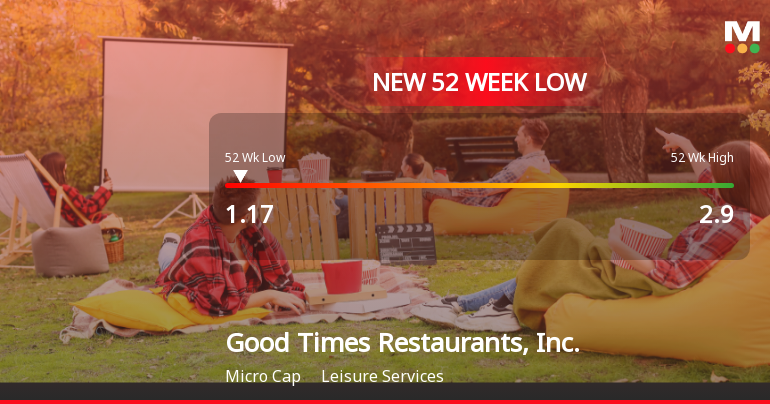
Good Times Restaurants Hits New 52-Week Low at $1.17
Good Times Restaurants, Inc. has reached a new 52-week low, reflecting a significant decline in its stock performance over the past year. With a market capitalization of approximately USD 19 million, the company has a low P/E ratio and no dividends. Financial metrics indicate a low debt-to-equity ratio and a potentially undervalued stock.
Read full news article Announcements

No announcement available
Corporate Actions
No corporate action available
Quality key factors
Factor
Value
Sales Growth (5y)
5.43%
EBIT Growth (5y)
14.05%
EBIT to Interest (avg)
3.53
Debt to EBITDA (avg)
0.46
Net Debt to Equity (avg)
0.20
Sales to Capital Employed (avg)
3.53
Tax Ratio
Tax Ratio is Negative%
Dividend Payout Ratio
0
Pledged Shares
0
Institutional Holding
13.92%
ROCE (avg)
12.70%
ROE (avg)
22.53%
Valuation key factors
Factor
Value
P/E Ratio
8
Industry P/E
Price to Book Value
0.63
EV to EBIT
14.37
EV to EBITDA
4.48
EV to Capital Employed
0.69
EV to Sales
0.18
PEG Ratio
2.13
Dividend Yield
NA
ROCE (Latest)
4.82%
ROE (Latest)
7.66%
Technicals key factors
Indicator
Weekly
Monthly
MACD
Mildly Bullish
Bearish
RSI
No Signal
No Signal
Bollinger Bands
Mildly Bearish
Mildly Bearish
Moving Averages
Bearish (Daily)
KST
Bearish
Bearish
Dow Theory
No Trend
No Trend
OBV
Mildly Bullish
No Trend
 Technical Indicator Scale: Bearish, Mildly Bearish, Sideways, Mildly Bullish, Bullish Turned
 Shareholding Snapshot : Sep 2025
Shareholding Compare (%holding)
Majority shareholders
Domestic Funds
Domestic Funds
Held in 6 Schemes (6.92%)
Foreign Institutions
Held by 2 Foreign Institutions (0.08%)
Strategic Entities with highest holding
Highest Public shareholder
Quarterly Results Snapshot (Consolidated) - Jun'25 - YoY
Jun'25
Jun'24
Change(%)
Net Sales
37.00
37.90
-2.37%
Operating Profit (PBDIT) excl Other Income
2.20
2.40
-8.33%
Interest
0.10
0.00
Exceptional Items
0.00
-0.20
100.00%
Consolidate Net Profit
1.50
1.40
7.14%
Operating Profit Margin (Excl OI)
33.20%
38.10%
-0.49%
USD in Million.

Net Sales
YoY Growth in quarter ended Jun 2025 is -2.37% vs 6.46% in Jun 2024
Consolidated Net Profit
YoY Growth in quarter ended Jun 2025 is 7.14% vs 40.00% in Jun 2024
Annual Results Snapshot (Consolidated) - Sep'24
Sep'24
Sep'23
Change(%)
Net Sales
142.30
138.20
2.97%
Operating Profit (PBDIT) excl Other Income
5.60
6.30
-11.11%
Interest
0.10
0.10
Exceptional Items
-0.40
-1.60
75.00%
Consolidate Net Profit
1.90
11.70
-83.76%
Operating Profit Margin (Excl OI)
12.30%
18.20%
-0.59%
USD in Million.

Net Sales
YoY Growth in year ended Sep 2024 is 2.97% vs 0.00% in Sep 2023
Consolidated Net Profit
YoY Growth in year ended Sep 2024 is -83.76% vs 1,400.00% in Sep 2023
About Good Times Restaurants, Inc.

Good Times Restaurants, Inc.
Leisure Services
Good Times Restaurants Inc. operates and franchises Good Times Burgers & Frozen Custard (Good Times) restaurants and Bad Daddy's Burger Bar concept (Bad Daddy's). The Company operates through two segments: Good Times Burgers and Frozen Custard restaurants, and Bad Daddy's Burger Bar restaurants. Good Times is a quick service restaurant concept. The menu of a Good Times restaurant includes hamburgers, cheeseburgers, chicken sandwiches, French fries, onion rings, soft drinks and frozen custard products. Its breakfast menu includes breakfast burritos, orange juice and coffee. Bad Daddy's operates in the burger casual dining sector and is chef driven, full service, full bar concept. Its menu consists of burgers, salads, sandwiches and appetizers. Its bar focuses on local, craft microbrew beers and specialty cocktails. The Company operates through its subsidiaries, Good Times Drive Thru, Inc., BD of Colorado, LLC, Bad Daddy's Franchise Development, LLC and Bad Daddy's International, LLC.
Company Coordinates
Company Details
400 S Union Blvd # 141 , LAKEWOOD CO : 80228-2924


Registrar Details
InfinHub Market Technologies FZ-LLC, Building-2, Unit 112, Dubai Internet City, Dubai, United Arab Emirates
GET THE MARKETSMOJO APP


Company
Stocks
Portfolio


"Investment in securities markets are subject to market risk. Read all the related documents carefully before investing."