
Compare Goyal Aluminiums with Similar Stocks
Stock DNA
Trading & Distributors
INR 101 Cr (Micro Cap)
40.00
23
0.00%
0.05
12.38%
4.16
Total Returns (Price + Dividend) 
Goyal Aluminiums for the last several years.
Risk Adjusted Returns v/s
Returns Beta

News
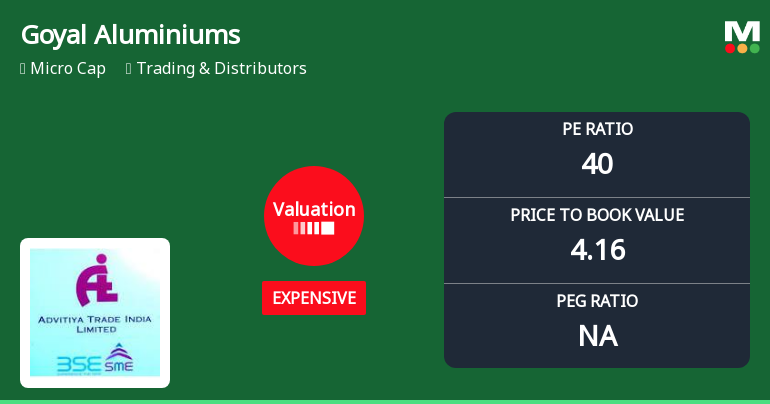
Goyal Aluminiums Ltd Valuation Shifts Signal Price Attractiveness Change
Goyal Aluminiums Ltd has experienced a notable shift in its valuation parameters, moving from a very expensive to an expensive rating, reflecting changing market perceptions and underlying financial metrics. Despite a recent downgrade to a Strong Sell rating, the stock’s price-to-earnings (P/E) and price-to-book value (P/BV) ratios remain elevated compared to peers, signalling caution for investors amid mixed performance and sector dynamics.
Read full news article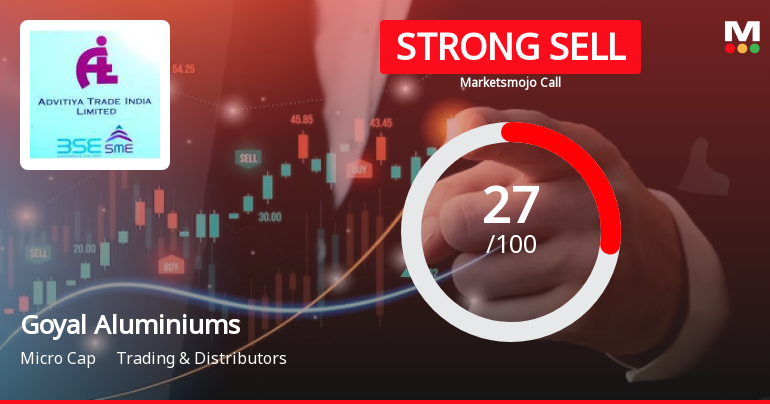
Goyal Aluminiums Ltd is Rated Strong Sell
Goyal Aluminiums Ltd is rated Strong Sell by MarketsMOJO, with this rating last updated on 16 Mar 2026. However, the analysis and financial metrics discussed here reflect the stock's current position as of 02 May 2026, providing investors with the latest insights into its performance and outlook.
Read full news article
Goyal Aluminiums Ltd Valuation Shifts Signal Price Attractiveness Change
Goyal Aluminiums Ltd, a micro-cap player in the Trading & Distributors sector, has seen a notable shift in its valuation parameters, moving from a very expensive to an expensive rating. This change reflects evolving market perceptions amid mixed financial metrics and a volatile price performance relative to benchmarks such as the Sensex. Investors and analysts are now reassessing the stock’s price attractiveness in light of its current price-to-earnings (P/E) and price-to-book value (P/BV) ratios, alongside peer comparisons and historical trends.
Read full news article Announcements
Corporate Actions

No Upcoming Board Meetings

No Dividend history available

Goyal Aluminiums Ltd has announced 1:10 stock split, ex-date: 25 Apr 23

Goyal Aluminiums Ltd has announced 44:100 bonus issue, ex-date: 13 Oct 21

No Rights history available
Quality key factors
Valuation key factors
Technicals key factors
 Technical Indicator Scale: Bearish, Mildly Bearish, Sideways, Mildly Bullish, Bullish Turned
 Shareholding Snapshot : Mar 2026
Shareholding Compare (%holding)
Promoters
None
Held by 0 Schemes
Held by 0 FIIs
Sandeep Goyal (54.84%)
None
26.94%
Quarterly Results Snapshot (Consolidated) - Dec'25 - YoY

YoY Growth in quarter ended Dec 2025 is -14.25% vs 33.74% in Dec 2024
YoY Growth in quarter ended Dec 2025 is -51.11% vs 13.92% in Dec 2024
Half Yearly Results Snapshot (Consolidated) - Sep'25
Growth in half year ended Sep 2025 is -26.63% vs 42.86% in Sep 2024

Growth in half year ended Sep 2025 is 58.54% vs 3.36% in Sep 2024
Nine Monthly Results Snapshot (Consolidated) - Dec'25
YoY Growth in nine months ended Dec 2025 is -22.58% vs 39.74% in Dec 2024
YoY Growth in nine months ended Dec 2025 is 12.21% vs 7.58% in Dec 2024
Annual Results Snapshot (Consolidated) - Mar'25
YoY Growth in year ended Mar 2025 is 11.76% vs 3.74% in Mar 2024
YoY Growth in year ended Mar 2025 is -10.55% vs 17.97% in Mar 2024
About Goyal Aluminiums Ltd

Company Coordinates


