
Compare Goyal Aluminiums with Similar Stocks
Stock DNA
Trading & Distributors
INR 100 Cr (Micro Cap)
22.00
21
0.00%
0.42
17.34%
3.96
Total Returns (Price + Dividend) 
Goyal Aluminiums for the last several years.
Risk Adjusted Returns v/s
Returns Beta

News
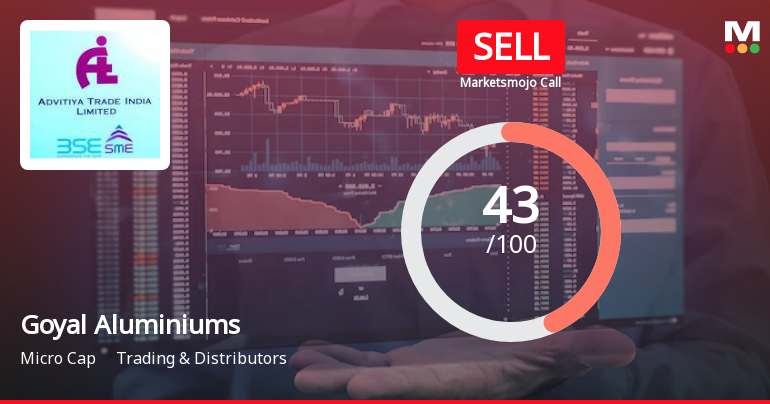
Goyal Aluminiums Ltd is Rated Sell
Goyal Aluminiums Ltd is rated 'Sell' by MarketsMOJO, with this rating last updated on 01 June 2026. However, the analysis and financial metrics discussed here reflect the stock's current position as of 04 June 2026, providing investors with the latest insights into the company’s performance and outlook.
Read full news articleAre Goyal Aluminiums Ltd latest results good or bad?
Goyal Aluminiums Ltd's latest financial results for Q4 FY26 reflect a notable surge in both net sales and consolidated net profit. The company reported consolidated net profit of ₹2.02 crores, representing a significant year-on-year growth of 1,162.50% compared to the previous year. Net sales also saw a robust increase, reaching ₹28.51 crores, which marks an 80.90% improvement year-on-year from ₹15.76 crores in Q4 FY25. This revenue growth was driven by a sequential increase of 67.41% from ₹17.03 crores in Q3 FY26. The operating margin, excluding other income, improved to 7.61%, the highest level recorded in the past eight quarters, indicating enhanced operational efficiency and cost management. The operating profit (PBDIT) also saw a substantial rise, climbing to ₹2.17 crores from just ₹0.16 crores in the same quarter last year. Despite these positive quarterly results, the company faces challenges regar...
Read full news article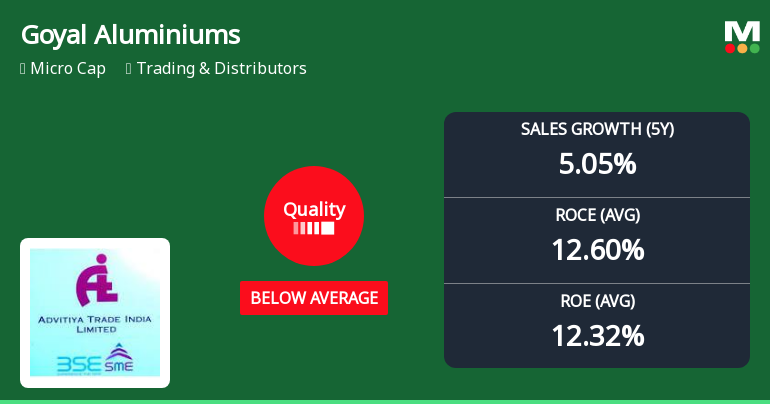
Goyal Aluminiums Ltd Quality Grade Downgrade Highlights Fundamental Challenges
Goyal Aluminiums Ltd has seen its quality grade downgraded from average to below average, reflecting a deterioration in key business fundamentals. Despite a strong five-year sales growth of 5.05% and EBIT growth of 15.42%, the company’s return ratios and capital efficiency metrics have weakened, raising concerns about its operational consistency and financial health amid a challenging market environment.
Read full news article Announcements
Announcement under Regulation 30 (LODR)-Newspaper Publication
01-Jun-2026 | Source : BSESubmission of newspaper advertisement pertaining to audited financial results for the quarter and financial year ended 31st March 2026.
Announcement under Regulation 30 (LODR)-Newspaper Publication
01-Jun-2026 | Source : BSESubmission of newspaper advertisement pertaining to audited financial results for the quarter and financial year ended 31st March 2026.
Outcome Of The Board Meeting Of The Company Dated May 29 2026 For The Financial Results
29-May-2026 | Source : BSEFinancial Results for the quarter and financial year ending 31st March 2026
Corporate Actions

No Upcoming Board Meetings

No Dividend history available

Goyal Aluminiums Ltd has announced 1:10 stock split, ex-date: 25 Apr 23

Goyal Aluminiums Ltd has announced 44:100 bonus issue, ex-date: 13 Oct 21

No Rights history available
Quality key factors
Valuation key factors
Technicals key factors
 Technical Indicator Scale: Bearish, Mildly Bearish, Sideways, Mildly Bullish, Bullish Turned
 Shareholding Snapshot : Mar 2026
Shareholding Compare (%holding)
Promoters
None
Held by 0 Schemes
Held by 0 FIIs
Sandeep Goyal (54.84%)
None
26.94%
Quarterly Results Snapshot (Consolidated) - Mar'26 - YoY

YoY Growth in quarter ended Mar 2026 is 80.90% vs -36.91% in Mar 2025
YoY Growth in quarter ended Mar 2026 is 1,162.50% vs -72.41% in Mar 2025
Half Yearly Results Snapshot (Consolidated) - Sep'25

Growth in half year ended Sep 2025 is -26.63% vs 42.86% in Sep 2024
Growth in half year ended Sep 2025 is 58.54% vs 3.36% in Sep 2024
Nine Monthly Results Snapshot (Consolidated) - Dec'25
YoY Growth in nine months ended Dec 2025 is -22.58% vs 39.74% in Dec 2024
YoY Growth in nine months ended Dec 2025 is 12.21% vs 7.58% in Dec 2024
Annual Results Snapshot (Consolidated) - Mar'26
YoY Growth in year ended Mar 2026 is -1.25% vs 11.76% in Mar 2025
YoY Growth in year ended Mar 2026 is 34.50% vs -10.55% in Mar 2025
About Goyal Aluminiums Ltd

Company Coordinates


