
Compare Goyal Associates with Similar Stocks
Stock DNA
Non Banking Financial Company (NBFC)
INR 4 Cr (Micro Cap)
NA (Loss Making)
20
0.00%
0.20
-5.34%
0.76
Total Returns (Price + Dividend) 
Goyal Associates for the last several years.
Risk Adjusted Returns v/s
Returns Beta

News
Are Goyal Associates Ltd latest results good or bad?
The latest financial results for Goyal Associates Ltd for the quarter ended March 2026 present a challenging scenario for the company. The net profit for this quarter was reported as a loss of ₹0.39 crores, a significant decline from a profit of ₹0.13 crores in the same quarter the previous year. This marks a stark shift in profitability, indicating operational difficulties. Revenue for the quarter was ₹0.38 crores, which reflects a year-on-year decline of 22.45% from ₹0.49 crores. However, there was a sequential improvement of 31.03% from the previous quarter's revenue of ₹0.29 crores. Despite this sequential growth, the overall revenue figures suggest that the company's core lending activities are under considerable pressure. The operating margin also saw a notable decline, with the company reporting an operating loss of ₹0.45 crores, resulting in an operating margin of -118.42%. This is a drastic drop ...
Read full news article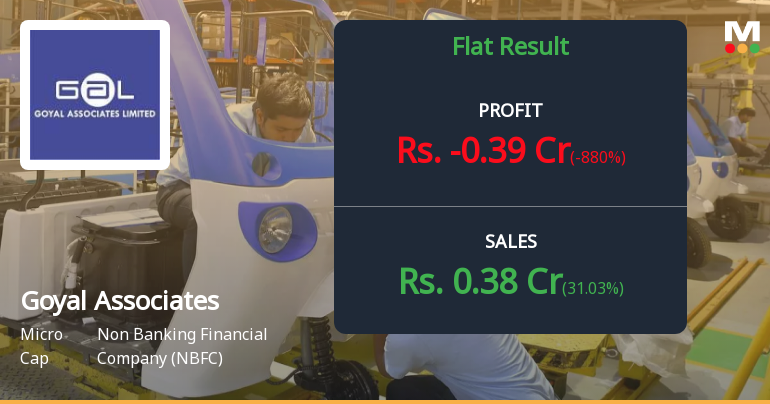
Goyal Associates Q4 FY26: Sharp Losses Trigger Alarm Bells for Micro-Cap NBFC
Goyal Associates Ltd., an Ahmedabad-based non-banking financial company, reported a jarring net loss of ₹0.39 crores in Q4 FY26 (Mar'26), marking a dramatic reversal from the ₹0.13 crores profit recorded in the year-ago quarter. The loss represents a complete collapse in profitability for the micro-cap NBFC, which has seen its market capitalisation shrink to just ₹4.00 crores. Shares closed at ₹0.74 on June 3, down 1.33% on the day and languishing 41.73% below levels seen a year ago.
Read full news article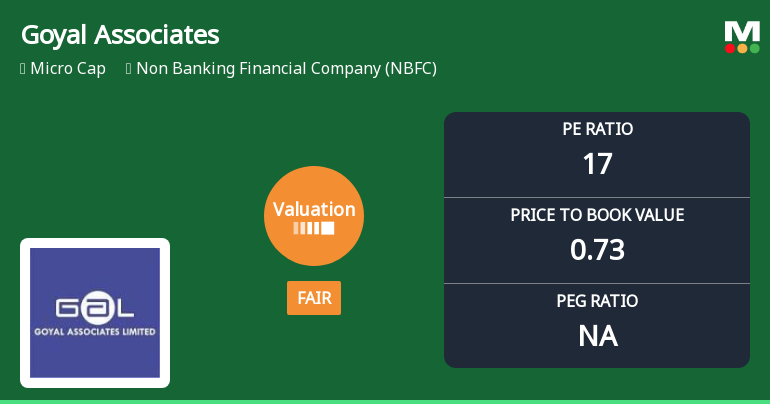
Goyal Associates Ltd Valuation Shifts to Fair Amidst Steep Price Declines
Goyal Associates Ltd, a micro-cap player in the Non Banking Financial Company (NBFC) sector, has witnessed a notable shift in its valuation parameters, moving from an attractive to a fair valuation grade. This change comes amid a sharp decline in its share price and deteriorating market sentiment, prompting a reassessment of its price-to-earnings (P/E) and price-to-book value (P/BV) ratios relative to historical averages and peer benchmarks.
Read full news article Announcements
FINANCIAL RESULT QTR4
01-Jun-2026 | Source : BSEFINANCIAL RESULT QTR4
Board Meeting Outcome for OUTCOME OF BOARD MEETING
01-Jun-2026 | Source : BSEOUTCOME OF BOARD MEETING
Board Meeting Intimation for Consider Financial Result For QTR4
30-May-2026 | Source : BSEGoyal Associates Ltdhas informed BSE that the meeting of the Board of Directors of the Company is scheduled on 01/06/2026 inter alia to consider and approve Financial Result for QTR4
Corporate Actions

No Upcoming Board Meetings

No Dividend history available

No Splits history available

No Bonus history available

No Rights history available
Quality key factors
Valuation key factors
Technicals key factors
 Technical Indicator Scale: Bearish, Mildly Bearish, Sideways, Mildly Bullish, Bullish Turned
 Shareholding Snapshot : Mar 2026
Shareholding Compare (%holding)
Non Institution
None
Held by 0 Schemes
Held by 0 FIIs
Krishnakant Bhimsen Goyal (4.72%)
Beemidi Madhusudhan Reddy (4.43%)
91.52%
Quarterly Results Snapshot (Standalone) - Mar'26 - QoQ

QoQ Growth in quarter ended Mar 2026 is 31.03% vs 0.00% in Dec 2025

QoQ Growth in quarter ended Mar 2026 is -880.00% vs 0.00% in Dec 2025
Half Yearly Results Snapshot (Standalone) - Sep'25
Growth in half year ended Sep 2025 is -54.03% vs -34.74% in Sep 2024
Growth in half year ended Sep 2025 is -76.67% vs -11.76% in Sep 2024
Nine Monthly Results Snapshot (Standalone) - Dec'25
YoY Growth in nine months ended Dec 2025 is -59.62% vs -24.73% in Dec 2024
YoY Growth in nine months ended Dec 2025 is -80.33% vs 24.49% in Dec 2024
Annual Results Snapshot (Standalone) - Mar'26
YoY Growth in year ended Mar 2026 is -52.85% vs -29.87% in Mar 2025
YoY Growth in year ended Mar 2026 is -136.49% vs 17.46% in Mar 2025
About Goyal Associates Ltd

Company Coordinates


