
Compare Gradiente Info. with Similar Stocks
Stock DNA
TV Broadcasting & Software
INR Cr (Micro Cap)
44.00
8
0.00%
0.00
0.00%
0.00
Total Returns (Price + Dividend) 
Gradiente Info. for the last several years.
Risk Adjusted Returns v/s
Returns Beta

News
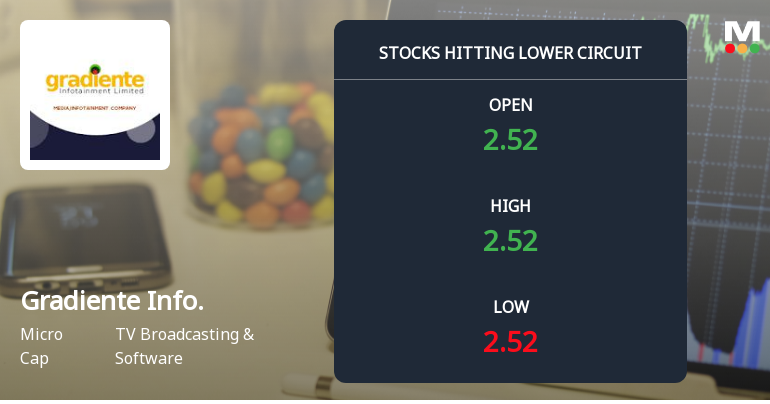
Gradiente Infotainment Ltd Locks at Lower Circuit With 4.91% Loss — Sellers Queue, No Buyers in Sight
At Rs 2.52, sellers were still queuing — but there were no buyers willing to take the other side. Gradiente Infotainment Ltd locked at its lower circuit of 4.91% on 10 Jun 2026, with unfilled sell orders and a frozen price, signalling persistent selling pressure in a micro-cap stock with limited liquidity.
Read full news article
Gradiente Infotainment Ltd Locks at Lower Circuit With 4.68% Loss — Sellers Queue, No Buyers in Sight
At Rs 2.65, sellers were still queuing — but there were no buyers willing to take the other side. Gradiente Infotainment Ltd locked at its lower circuit of 4.68% on 09 Jun 2026, with unfilled sell orders and a frozen price, signalling persistent selling pressure in a micro-cap stock with limited liquidity.
Read full news article
Gradiente Infotainment Ltd Locks at Lower Circuit With 4.8% Loss — Sellers Queue, No Buyers in Sight
At Rs 2.78, sellers were still queuing — but there were no buyers willing to take the other side. Gradiente Infotainment Ltd locked at its lower circuit of 4.79% on 8 Jun 2026, with unfilled sell orders and a frozen price, signalling persistent selling pressure in a micro-cap stock with limited liquidity.
Read full news article Announcements
Closure of Trading Window
06-Jul-2023 | Source : BSEClosure of Trading Window
Gradiente Infotainment schedules board meeting
27-Apr-2023 | Source : BSEGradiente Infotainment will hold a meeting of the Board of Directors of the Company on 5 May 2023.
Gradiente Infotainment schedules EGM
30-Nov-2022 | Source : BSEGradiente Infotainment announced that an Extra Ordinary General Meeting (EGM) of the Company will be held on 27 December 2022 .
Corporate Actions

No Upcoming Board Meetings

No Dividend history available

No Splits history available

No Bonus history available

No Rights history available
Quality key factors
Valuation key factors
Technicals key factors
 Technical Indicator Scale: Bearish, Mildly Bearish, Sideways, Mildly Bullish, Bullish Turned
 Shareholding Snapshot : May 2026
Shareholding Compare (%holding)
Non Institution
1.4211
Held by 0 Schemes
Held by 0 FIIs
Vimal Raj Mathur (9.76%)
Ramaswamyreddy Pedinekaluva (15.91%)
65.78%
Quarterly Results Snapshot (Standalone) - Mar'26 - QoQ

QoQ Growth in quarter ended Mar 2026 is 10.45% vs 670.41% in Dec 2025
QoQ Growth in quarter ended Mar 2026 is -95.97% vs 588.89% in Dec 2025
Half Yearly Results Snapshot (Standalone) - Sep'25
Growth in half year ended Sep 2025 is -77.09% vs 0.00% in Sep 2024
Growth in half year ended Sep 2025 is -72.99% vs 0.00% in Sep 2024
Nine Monthly Results Snapshot (Standalone) - Dec'25
YoY Growth in nine months ended Dec 2025 is -21.49% vs 3,487.27% in Dec 2024
YoY Growth in nine months ended Dec 2025 is 28.96% vs 3,057.14% in Dec 2024
Annual Results Snapshot (Standalone) - Mar'26
YoY Growth in year ended Mar 2026 is 40.32% vs 133.59% in Mar 2025

YoY Growth in year ended Mar 2026 is 318.31% vs -30.39% in Mar 2025
About Gradiente Infotainment Ltd

Company Coordinates


