
Compare Grandma Trading with Similar Stocks
Stock DNA
Trading & Distributors
INR 4 Cr (Micro Cap)
NA (Loss Making)
23
0.00%
0.18
-9.00%
3.66
Total Returns (Price + Dividend) 
Grandma Trading for the last several years.
Risk Adjusted Returns v/s
Returns Beta

News

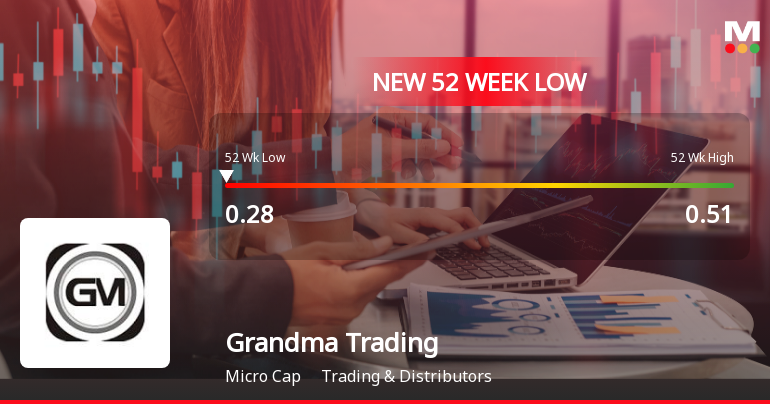
Grandma Trading & Agencies Ltd Falls to 52-Week Low of Rs 0.28 as Sell-Off Deepens
For the seventh consecutive session, Grandma Trading & Agencies Ltd has closed lower, culminating in a fresh 52-week low of Rs 0.28 on 16 Jul 2026. This marks a 20% decline over the past week and extends the stock’s one-year loss to 42.86%, significantly underperforming the Sensex’s 6.43% drop over the same period.
Read full news article
Grandma Trading & Agencies Ltd Falls to 52-Week Low of Rs 0.29 as Sell-Off Deepens
For the sixth consecutive session, Grandma Trading & Agencies Ltd has closed lower, culminating in a fresh 52-week low of Rs 0.29 on 15 Jul 2026. This marks a 17.14% decline over this losing streak and a 40.82% drop over the past year, significantly underperforming the Sensex's modest 6.05% fall during the same period.
Read full news article Announcements
Compliances-Certificate under Reg. 74 (5) of SEBI (DP) Regulations 2018
04-Jul-2026 | Source : BSECompliances certificate under Regulations 74(5) of SEBI (DP) Regulations2018 for the quarter ended 30th June2026
Closure of Trading Window
25-Jun-2026 | Source : BSEIntimation of closure of Trading Window for the quarter ended 30.06.2026.
Announcement under Regulation 30 (LODR)-Newspaper Publication
29-May-2026 | Source : BSENEWSPAPER ADVERTISEMENT FOR AUDITED FINANCIAL RESULT FOR THE QUARTER AND YEAR ENDED AS ON 31.03.2026
Corporate Actions

No Upcoming Board Meetings

No Dividend history available

Grandma Trading & Agencies Ltd has announced 1:10 stock split, ex-date: 26 Feb 15

No Bonus history available

No Rights history available
Quality key factors
Valuation key factors
Technicals key factors
 Technical Indicator Scale: Bearish, Mildly Bearish, Sideways, Mildly Bullish, Bullish Turned
 Shareholding Snapshot : Mar 2026
Shareholding Compare (%holding)
Non Institution
None
Held by 0 Schemes
Held by 0 FIIs
Bharat Bansilal Jain (6.01%)
Segment Agencies Pvt. Ltd. (4.96%)
43.97%
Quarterly Results Snapshot (Standalone) - Mar'26 - QoQ

QoQ Growth in quarter ended Mar 2026 is 245.45% vs 175.00% in Dec 2025
QoQ Growth in quarter ended Mar 2026 is 333.33% vs 40.00% in Dec 2025
Half Yearly Results Snapshot (Standalone) - Sep'25

Growth in half year ended Sep 2025 is -75.00% vs 0.00% in Sep 2024
Growth in half year ended Sep 2025 is 91.85% vs -938.46% in Sep 2024
Nine Monthly Results Snapshot (Standalone) - Dec'25
YoY Growth in nine months ended Dec 2025 is -16.67% vs 0.00% in Dec 2024
YoY Growth in nine months ended Dec 2025 is 89.78% vs -1,270.00% in Dec 2024
Annual Results Snapshot (Standalone) - Mar'26
YoY Growth in year ended Mar 2026 is 140.91% vs 69.23% in Mar 2025
YoY Growth in year ended Mar 2026 is 95.17% vs -7,150.00% in Mar 2025
About Grandma Trading & Agencies Ltd

Company Coordinates


