
Compare Grandma Trading with Similar Stocks
Stock DNA
Trading & Distributors
INR 6 Cr (Micro Cap)
NA (Loss Making)
15
0.00%
0.18
-9.00%
5.62
Total Returns (Price + Dividend) 
Grandma Trading for the last several years.
Risk Adjusted Returns v/s
Returns Beta

News

Five Consecutive Losses Push Grandma Trading & Agencies Ltd to a New 52-Week Low
For the fifth straight session, Grandma Trading & Agencies Ltd closed lower, slipping to a fresh 52-week low of Rs 0.41 on 10 Jun 2026, marking a cumulative decline of 16.33% over this period.
Read full news article
Grandma Trading & Agencies Ltd Falls to 52-Week Low of Rs 0.43 as Sell-Off Deepens
For the third consecutive session, Grandma Trading & Agencies Ltd has seen its share price decline, culminating in a fresh 52-week low of Rs 0.43 on 9 June 2026. This marks a 12.24% drop over the last three days, underscoring persistent selling pressure amid a challenging market backdrop.
Read full news article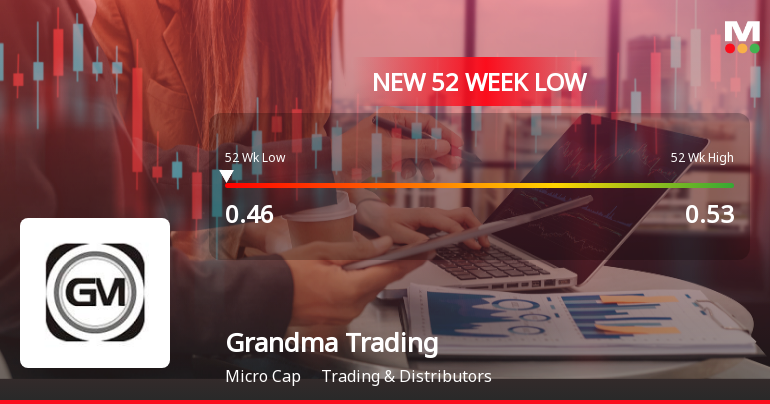
Announcements
Announcement under Regulation 30 (LODR)-Newspaper Publication
29-May-2026 | Source : BSENEWSPAPER ADVERTISEMENT FOR AUDITED FINANCIAL RESULT FOR THE QUARTER AND YEAR ENDED AS ON 31.03.2026
Board Meeting Outcome for Audited Financial Results Of The Company For The Quarter And Year Ended 31St March 2026
28-May-2026 | Source : BSEAudited Financial Results of the Company for the quarter and year ended 31st March 2026
Approved Of Audited Financial Results Of The Company For The Quarter And Year Ended 31St March 2026
28-May-2026 | Source : BSEApproval of Audited Financial Result of the Company for the quarter and year ended 31st March2026
Corporate Actions

No Upcoming Board Meetings

No Dividend history available

Grandma Trading & Agencies Ltd has announced 1:10 stock split, ex-date: 26 Feb 15

No Bonus history available

No Rights history available
Quality key factors
Valuation key factors
Technicals key factors
 Technical Indicator Scale: Bearish, Mildly Bearish, Sideways, Mildly Bullish, Bullish Turned
 Shareholding Snapshot : Mar 2026
Shareholding Compare (%holding)
Non Institution
None
Held by 0 Schemes
Held by 0 FIIs
Bharat Bansilal Jain (6.01%)
Segment Agencies Pvt. Ltd. (4.96%)
43.97%
Quarterly Results Snapshot (Standalone) - Mar'26 - QoQ

QoQ Growth in quarter ended Mar 2026 is 245.45% vs 175.00% in Dec 2025
QoQ Growth in quarter ended Mar 2026 is 333.33% vs 40.00% in Dec 2025
Half Yearly Results Snapshot (Standalone) - Sep'25

Growth in half year ended Sep 2025 is -75.00% vs 0.00% in Sep 2024
Growth in half year ended Sep 2025 is 91.85% vs -938.46% in Sep 2024
Nine Monthly Results Snapshot (Standalone) - Dec'25
YoY Growth in nine months ended Dec 2025 is -16.67% vs 0.00% in Dec 2024
YoY Growth in nine months ended Dec 2025 is 89.78% vs -1,270.00% in Dec 2024
Annual Results Snapshot (Standalone) - Mar'26
YoY Growth in year ended Mar 2026 is 140.91% vs 69.23% in Mar 2025
YoY Growth in year ended Mar 2026 is 95.17% vs -7,150.00% in Mar 2025
About Grandma Trading & Agencies Ltd

Company Coordinates


