
Compare Graviss Hospital with Similar Stocks
Dashboard
Poor Management Efficiency with a low ROE of 1.97%
- The company has been able to generate a Return on Equity (avg) of 1.97% signifying low profitability per unit of shareholders funds
Poor long term growth as Operating profit has grown by an annual rate 15.45% of over the last 5 years
Flat results in Mar 26
With ROE of -0.2, it has a Very Expensive valuation with a 1.1 Price to Book Value
Below par performance in long term as well as near term
Stock DNA
Hotels & Resorts
INR 202 Cr (Micro Cap)
NA (Loss Making)
38
0.00%
-0.01
-0.21%
1.07
Total Returns (Price + Dividend) 
Latest dividend: 0.23999999999999996 per share ex-dividend date: Feb-13-2012
Risk Adjusted Returns v/s
Returns Beta

News
Graviss Hospitality Ltd is Rated Sell
Graviss Hospitality Ltd is rated 'Sell' by MarketsMOJO, with this rating last updated on 12 May 2026. However, the analysis and financial metrics discussed here reflect the company’s current position as of 23 June 2026, providing investors with the most up-to-date view of the stock’s fundamentals, returns, and technical outlook.
Read full news article
Graviss Hospitality Ltd is Rated Sell
Graviss Hospitality Ltd is rated 'Sell' by MarketsMOJO, with this rating last updated on 12 May 2026. However, the analysis and financial metrics discussed here reflect the stock's current position as of 12 June 2026, providing investors with the most recent and relevant data to assess the company’s outlook.
Read full news article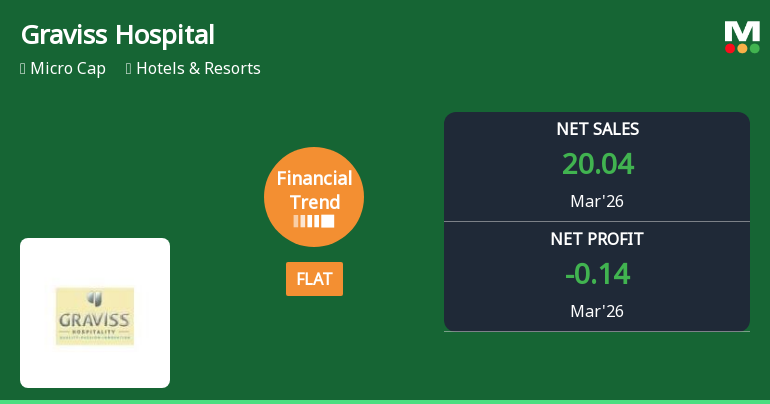
Graviss Hospitality Ltd Reports Flat Quarterly Performance Amid Mixed Financial Trends
Graviss Hospitality Ltd, a micro-cap player in the Hotels & Resorts sector, has reported a flat financial performance for the quarter ended March 2026, signalling a pause in its previously positive growth trajectory. Despite notable gains in profit before tax and net sales, the company’s overall financial trend has shifted from positive to flat, reflecting a complex mix of operational strengths and challenges.
Read full news article Announcements
Announcement under Regulation 30 (LODR)-Newspaper Publication
05-Jun-2026 | Source : BSENewspaper Publication for Notice of Postal Ballot
Shareholder Meeting / Postal Ballot-Notice of Postal Ballot
04-Jun-2026 | Source : BSEIntimation of Postal Ballot Notice
Announcement under Regulation 30 (LODR)-Change in Directorate
01-Jun-2026 | Source : BSEDisclosure under Regulation 30 of Securities and Exchange Board of India (Listing Obligations and Disclosure Requirements) Regulations 2015.
Corporate Actions

No Upcoming Board Meetings

Graviss Hospitality Ltd has declared 12% dividend, ex-date: 13 Feb 12

Graviss Hospitality Ltd has announced 2:10 stock split, ex-date: 04 Aug 08

No Bonus history available

No Rights history available
Quality key factors
Valuation key factors
Technicals key factors
 Technical Indicator Scale: Bearish, Mildly Bearish, Sideways, Mildly Bullish, Bullish Turned
 Shareholding Snapshot : Mar 2026
Shareholding Compare (%holding)
Promoters
None
Held by 0 Schemes
Held by 0 FIIs
Satinetta Trading Llp (32.57%)
Inter-continental Hotels Corporation (6.22%)
8.24%
Quarterly Results Snapshot (Consolidated) - Mar'26 - YoY

YoY Growth in quarter ended Mar 2026 is 3.09% vs 15.58% in Mar 2025

YoY Growth in quarter ended Mar 2026 is 39.13% vs -122.77% in Mar 2025
Half Yearly Results Snapshot (Consolidated) - Sep'25
Growth in half year ended Sep 2025 is 1.01% vs 13.06% in Sep 2024
Growth in half year ended Sep 2025 is -142.93% vs 498.06% in Sep 2024
Nine Monthly Results Snapshot (Consolidated) - Dec'25
YoY Growth in nine months ended Dec 2025 is 3.29% vs 11.71% in Dec 2024
YoY Growth in nine months ended Dec 2025 is -105.52% vs 382.91% in Dec 2024
Annual Results Snapshot (Consolidated) - Mar'26
YoY Growth in year ended Mar 2026 is 3.21% vs 12.95% in Mar 2025
YoY Growth in year ended Mar 2026 is -106.92% vs 211.96% in Mar 2025
About Graviss Hospitality Ltd

Company Coordinates


