
Compare Greencrest Finan with Similar Stocks
Stock DNA
Diversified Commercial Services
INR 20 Cr (Micro Cap)
15.00
21
0.00%
0.90
2.40%
0.34
Total Returns (Price + Dividend) 
Greencrest Finan for the last several years.
Risk Adjusted Returns v/s
Returns Beta

News
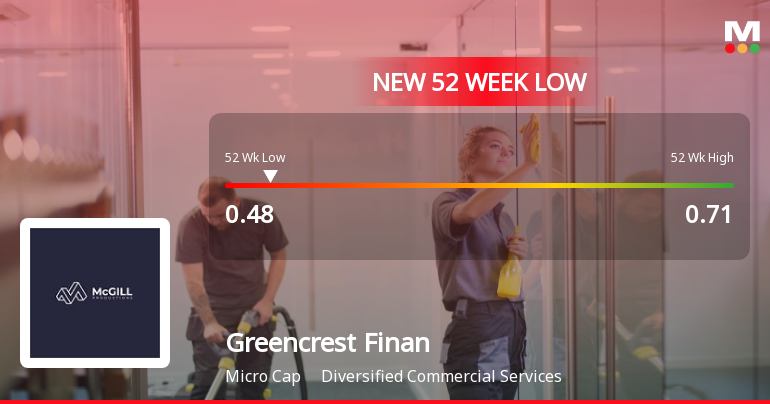
Greencrest Financial Services Ltd Falls to 52-Week Low of Rs 0.48 as Sell-Off Deepens
A sustained decline has pushed Greencrest Financial Services Ltd to a fresh 52-week low of Rs 0.48 on 11 Jun 2026, marking a significant 32.4% drop from its 52-week high of Rs 0.71. This downturn comes amid a backdrop of weakening fundamentals and persistent losses, raising questions about the stock’s near-term outlook.
Read full news article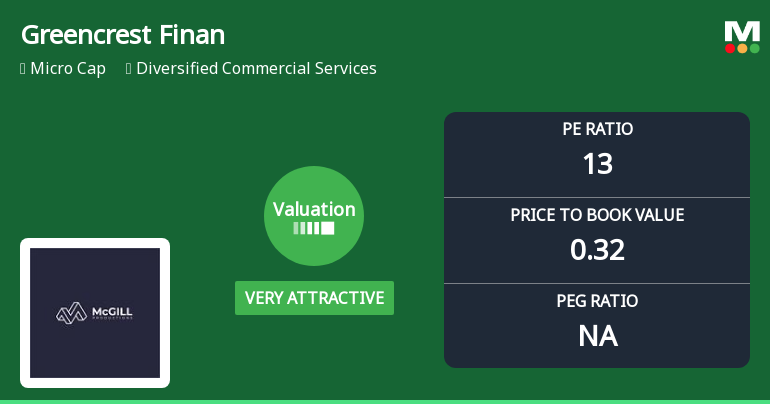
Greencrest Financial Services Ltd: Valuation Shifts Signal Renewed Price Attractiveness
Greencrest Financial Services Ltd, a micro-cap player in the diversified commercial services sector, has seen a significant shift in its valuation parameters, moving from a very expensive to a very attractive rating. Despite this positive change in valuation metrics, the stock’s returns have lagged considerably behind the broader market benchmarks over multiple time horizons.
Read full news articleAre Greencrest Financial Services Ltd latest results good or bad?
Greencrest Financial Services Ltd's latest financial results for the quarter ending March 2026 reveal a complex operational landscape characterized by significant revenue growth alongside persistent losses. The company reported a net sales figure of ₹14.41 crores, reflecting a year-on-year growth of 15.46%. This growth is notable as it marks the highest quarterly revenue in recent periods. However, the company simultaneously experienced a net loss of ₹1.41 crores, marking its second consecutive quarterly loss, which raises concerns about its ability to convert revenue into sustainable profitability. The operating margin for the quarter was reported at -10.34%, a stark contrast to the previous quarter's positive margin of 21.14%. This volatility in operating margins indicates ongoing challenges in cost management and operational efficiency. Furthermore, the return on equity (ROE) stood at -2.12%, highlighti...
Read full news article Announcements
Announcement under Regulation 30 (LODR)-Newspaper Publication
29-May-2026 | Source : BSEPlease find attached Newspaper cuttings of publication of Audited Financial Results for QE/YE March 31 2026
Results - Audited Financial Results For QE/YE March 31 2026
28-May-2026 | Source : BSEPlease find attached Audited Financial Results for QE/YE March 31 2026
Board Meeting Intimation for Approval Of Audited Financial Results For YE March 31 2026
15-Apr-2026 | Source : BSEGreencrest Financial Services Ltdhas informed BSE that the meeting of the Board of Directors of the Company is scheduled on 28/05/2026 inter alia to consider and approve Audited Financial Results for YE March 31 2026
Corporate Actions

No Upcoming Board Meetings

No Dividend history available

Greencrest Financial Services Ltd has announced 1:10 stock split, ex-date: 12 Oct 22

No Bonus history available

No Rights history available
Quality key factors
Valuation key factors
Technicals key factors
 Technical Indicator Scale: Bearish, Mildly Bearish, Sideways, Mildly Bullish, Bullish Turned
 Shareholding Snapshot : Mar 2026
Shareholding Compare (%holding)
Non Institution
None
Held by 0 Schemes
Held by 0 FIIs
Gold Mouhar Vyapaar Pvt. Ltd. (0.76%)
Neelam Rajinder Miglani (6.28%)
89.6%
Quarterly Results Snapshot (Standalone) - Mar'26 - YoY

YoY Growth in quarter ended Mar 2026 is 15.46% vs 50.72% in Mar 2025

YoY Growth in quarter ended Mar 2026 is 66.43% vs 38.24% in Mar 2025
Half Yearly Results Snapshot (Standalone) - Sep'25
Growth in half year ended Sep 2025 is -70.14% vs 81.70% in Sep 2024
Growth in half year ended Sep 2025 is -56.25% vs -32.93% in Sep 2024
Nine Monthly Results Snapshot (Standalone) - Dec'25
YoY Growth in nine months ended Dec 2025 is -60.01% vs 58.32% in Dec 2024
YoY Growth in nine months ended Dec 2025 is -48.89% vs -33.25% in Dec 2024
Annual Results Snapshot (Standalone) - Mar'26
YoY Growth in year ended Mar 2026 is -46.89% vs 82.76% in Mar 2025
YoY Growth in year ended Mar 2026 is 10.66% vs 15.09% in Mar 2025
About Greencrest Financial Services Ltd

Company Coordinates


