
Compare Greenpanel Inds. with Similar Stocks
Stock DNA
Plywood Boards/ Laminates
INR 2,411 Cr (Small Cap)
17.00
54
0.00%
0.12
-2.10%
1.71
Total Returns (Price + Dividend) 
Latest dividend: 0.3 per share ex-dividend date: Feb-18-2025
Risk Adjusted Returns v/s
Returns Beta

News

Greenpanel Industries Ltd Technical Momentum Shifts Amid Bearish Market Trends
Greenpanel Industries Ltd has experienced a subtle shift in its technical momentum, moving from a predominantly bearish stance to a mildly bearish outlook, as reflected in recent technical indicators. Despite a modest day gain of 2.42%, the stock remains under pressure with a strong sell rating and a challenging long-term performance compared to the broader market.
Read full news article
Greenpanel Industries Downgraded to Strong Sell Amid Weak Financials and Bearish Technicals
Greenpanel Industries Ltd, a small-cap player in the plywood boards and laminates sector, has been downgraded from a Sell to a Strong Sell rating as of 22 June 2026. This revision reflects deteriorating technical indicators, worsening financial trends, and valuation concerns, despite some operational strengths. The company’s stock has underperformed the broader market significantly over multiple time horizons, prompting a reassessment of its investment appeal.
Read full news article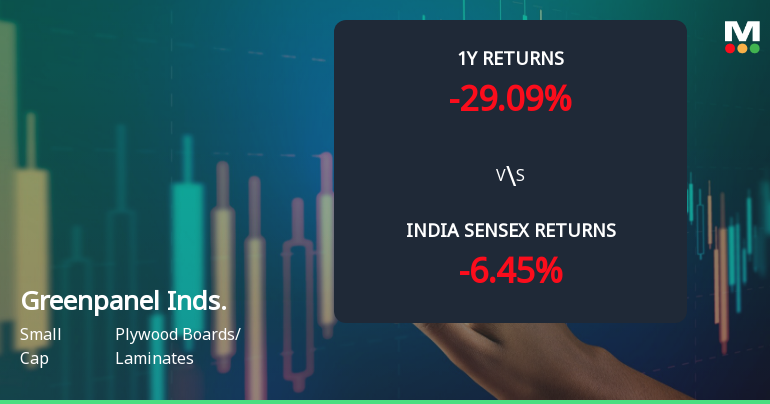
Greenpanel Industries Ltd Faces Bearish Momentum Amid Technical Downgrade
Greenpanel Industries Ltd has experienced a notable shift in price momentum, with technical indicators signalling a bearish trend across multiple timeframes. The company’s shares have declined modestly in recent sessions, reflecting growing investor caution amid deteriorating technical parameters and a challenging market backdrop.
Read full news article Announcements
Corporate Actions

No Upcoming Board Meetings

Greenpanel Industries Ltd has declared 50% dividend, ex-date: 31 Jul 26

No Splits history available

No Bonus history available

No Rights history available
Quality key factors
Valuation key factors
Technicals key factors
 Technical Indicator Scale: Bearish, Mildly Bearish, Sideways, Mildly Bullish, Bullish Turned
 Shareholding Snapshot : Mar 2026
Shareholding Compare (%holding)
Promoters
None
Held by 13 Schemes (26.11%)
Held by 44 FIIs (1.07%)
Prime Holdings Pvt. Ltd. (39.24%)
Bandhan Value Fund (7.05%)
14.26%
Quarterly Results Snapshot (Standalone) - Mar'26 - QoQ

QoQ Growth in quarter ended Mar 2026 is -4.17% vs 5.13% in Dec 2025
QoQ Growth in quarter ended Mar 2026 is -86.62% vs 267.32% in Dec 2025
Half Yearly Results Snapshot (Standalone) - Sep'25

Growth in half year ended Sep 2025 is 3.18% vs -10.57% in Sep 2024
Growth in half year ended Sep 2025 is -219.05% vs -56.00% in Sep 2024
Nine Monthly Results Snapshot (Standalone) - Dec'25
YoY Growth in nine months ended Dec 2025 is 7.46% vs -9.33% in Dec 2024
YoY Growth in nine months ended Dec 2025 is -171.40% vs -59.48% in Dec 2024
Annual Results Snapshot (Standalone) - Mar'26
YoY Growth in year ended Mar 2026 is 7.22% vs -8.38% in Mar 2025
YoY Growth in year ended Mar 2026 is -140.40% vs -46.68% in Mar 2025
About Greenpanel Industries Ltd

Company Coordinates


