
Compare GSB Finance with Similar Stocks
Dashboard
Weak Long Term Fundamental Strength with an average Return on Equity (ROE) of 3.64%
- Poor long term growth as Net Sales has grown by an annual rate of -3.79% and Operating profit at -27.52%
Flat results in Mar 26
With ROE of -2.3, it has a Very Expensive valuation with a 1.4 Price to Book Value
Stock DNA
Non Banking Financial Company (NBFC)
INR 21 Cr (Micro Cap)
NA (Loss Making)
21
0.00%
0.00
-2.27%
1.47
Total Returns (Price + Dividend) 
Latest dividend: 0.2 per share ex-dividend date: Sep-24-2018
Risk Adjusted Returns v/s
Returns Beta

News

GSB Finance Ltd Downgraded to Strong Sell Amidst Weak Fundamentals and Technical Setbacks
GSB Finance Ltd, a micro-cap player in the Non Banking Financial Company (NBFC) sector, has seen its investment rating downgraded from Sell to Strong Sell as of 12 June 2026. This revision reflects a combination of deteriorating financial fundamentals, expensive valuation metrics, and a shift in technical indicators signalling caution for investors.
Read full news article
GSB Finance Ltd Upgraded to Sell on Technical Improvements Despite Weak Fundamentals
GSB Finance Ltd has seen its investment rating upgraded from Strong Sell to Sell as of 10 June 2026, driven primarily by a shift in technical indicators despite persistent fundamental challenges. The micro-cap NBFC’s recent performance and valuation metrics present a mixed picture, with technical signals improving while financial trends remain subdued.
Read full news article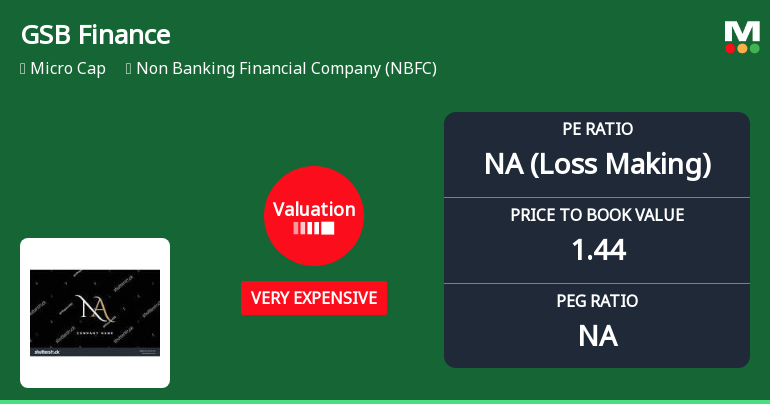
GSB Finance Ltd Valuation Shifts Signal Elevated Price Risk Amid Strong Historical Returns
GSB Finance Ltd, a micro-cap player in the Non Banking Financial Company (NBFC) sector, has seen its valuation parameters shift markedly, with its price-to-earnings (P/E) ratio plunging to a negative -63.75 and its price-to-book value (P/BV) rising to 1.44. Despite a strong long-term return profile, the company’s valuation grade has deteriorated from risky to very expensive, prompting a downgrade in its Mojo Grade to Strong Sell as of 14 May 2026.
Read full news article Announcements
Announcement under Regulation 30 (LODR)-Newspaper Publication
01-Jun-2026 | Source : BSESubmission of Newspaper publications made pertaining to Financial Results - Q4/2025-26 of the Company.
Board Meeting Outcome for Outcome Of The Board Meeting Held Today Inter-Alia To Approve The Audited Standalone Financial Results For The Quarter And Year Ended 31.03.2026.
29-May-2026 | Source : BSEOutcome of the Board Meeting held today inter-alia to consider and approve the audited Standalone Financial Results for the quarter and year ended 31.03.2026.
Financial Results For The Period Ended 31.03.2026.
29-May-2026 | Source : BSEFinancial Results for the period ended 31.03.2026.
Corporate Actions

No Upcoming Board Meetings

GSB Finance Ltd has declared 2% dividend, ex-date: 24 Sep 18

No Splits history available

No Bonus history available

No Rights history available
Quality key factors
Valuation key factors
Technicals key factors
 Technical Indicator Scale: Bearish, Mildly Bearish, Sideways, Mildly Bullish, Bullish Turned
 Shareholding Snapshot : Mar 2026
Shareholding Compare (%holding)
Promoters
None
Held by 0 Schemes
Held by 0 FIIs
Vivek Kumar Singhal (26.17%)
Giriraj Stock Broking Private Limited (3.86%)
37.86%
Quarterly Results Snapshot (Standalone) - Mar'26 - QoQ

QoQ Growth in quarter ended Mar 2026 is -9.68% vs -3.13% in Dec 2025
QoQ Growth in quarter ended Mar 2026 is -272.22% vs 160.00% in Dec 2025
Half Yearly Results Snapshot (Standalone) - Sep'25
Growth in half year ended Sep 2025 is -41.12% vs 46.58% in Sep 2024
Growth in half year ended Sep 2025 is -127.54% vs -56.60% in Sep 2024
Nine Monthly Results Snapshot (Standalone) - Dec'25
YoY Growth in nine months ended Dec 2025 is -37.75% vs 33.63% in Dec 2024
YoY Growth in nine months ended Dec 2025 is -101.22% vs -48.10% in Dec 2024
Annual Results Snapshot (Standalone) - Mar'26
YoY Growth in year ended Mar 2026 is -31.46% vs 37.98% in Mar 2025
YoY Growth in year ended Mar 2026 is -143.06% vs -32.71% in Mar 2025
About GSB Finance Ltd

Company Coordinates


