
Compare GSM Foils with Similar Stocks
Dashboard
High Management Efficiency with a high ROCE of 27.68%
Strong ability to service debt as the company has a low Debt to EBITDA ratio of 1.49 times
Healthy long term growth as Net Sales has grown by an annual rate of 92.90% and Operating profit at 96.51%
With a growth in Net Sales of 23.16%, the company declared Outstanding results in Mar 26
With ROCE of 24.8, it has a Fair valuation with a 3.5 Enterprise value to Capital Employed
Majority shareholders : Promoters
Stock DNA
Non - Ferrous Metals
INR 379 Cr (Micro Cap)
19.00
12
0.00%
0.59
26.63%
4.99
Total Returns (Price + Dividend) 
GSM Foils for the last several years.
Risk Adjusted Returns v/s
Returns Beta

News
Are GSM Foils Ltd latest results good or bad?
GSM Foils Ltd's latest financial results for Q1 FY27 highlight a robust operational performance characterized by significant revenue and profit growth. The company reported net sales of ₹96.89 crores, reflecting an 86.33% year-on-year increase and an 18.61% sequential growth from the previous quarter. This marks the seventh consecutive quarter of revenue growth, showcasing the company's ability to leverage favorable industry conditions and operational efficiency. Net profit for the quarter reached ₹7.62 crores, which is a 98.96% increase year-on-year and a 21.34% rise compared to the prior quarter. The operating margin also saw a slight expansion to 11.88%, up 34 basis points from the previous quarter, indicating effective cost management alongside revenue growth. The company has demonstrated strong operational metrics, with a return on equity (ROE) of 28.78%, positioning it favorably within its sector. H...
Read full news article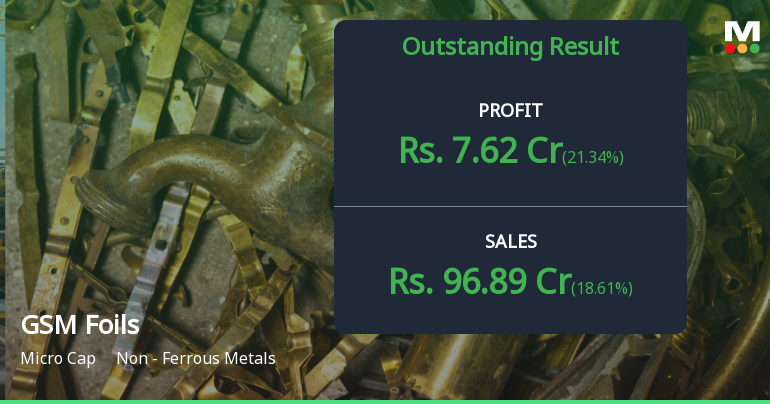
GSM Foils Q1 FY27: Revenue Surge Masks Valuation Concerns
GSM Foils Ltd., a micro-cap player in the non-ferrous metals sector, delivered stellar operational performance in Q1 FY27, posting net profit of ₹7.62 crores—up 21.34% quarter-on-quarter and 98.96% year-on-year. The ₹379 crore market capitalisation company continues to demonstrate exceptional growth momentum, with revenues surging 86.33% year-on-year to ₹96.89 crores. However, the stock's premium valuation at 18.55 times trailing earnings and trading near its 52-week high of ₹270.25 raises questions about sustainability despite strong fundamentals.
Read full news articleAre GSM Foils Ltd latest results good or bad?
GSM Foils Ltd has reported its financial results for Q4 FY26, showcasing significant operational trends. The company achieved net sales of ₹81.69 crores, reflecting a sequential growth of 23.16% from the previous quarter and a remarkable year-on-year increase of 79.11%. This marks the highest quarterly revenue in the company's history, indicating robust demand and successful market penetration. Net profit for the quarter reached ₹6.28 crores, which is an increase of 17.82% compared to the previous quarter and an impressive 83.63% year-on-year growth. The profit after tax margin stood at 7.69%, slightly lower than the previous quarter's margin, attributed to rising interest costs as the company expanded its working capital facilities. The operating profit before depreciation, interest, and tax (PBDIT) was reported at ₹9.43 crores, yielding an operating margin of 11.54%. While this represents a decline from...
Read full news article Announcements
Corporate Actions

No Upcoming Board Meetings

No Dividend history available

No Splits history available

No Bonus history available

GSM Foils Ltd has announced 1:10 rights issue, ex-date: 28 Aug 25
Quality key factors
Valuation key factors
Technicals key factors
 Technical Indicator Scale: Bearish, Mildly Bearish, Sideways, Mildly Bullish, Bullish Turned
 Shareholding Snapshot : Jun 2026
Shareholding Compare (%holding)
Promoters
None
Held by 0 Schemes
Held by 0 FIIs
Mohansingh Laxmansingh Parmar (34.81%)
Smart Horizon Opportunity Fund (1.82%)
27.28%
Quarterly Results Snapshot (Standalone) - Jun'26 - QoQ

QoQ Growth in quarter ended Jun 2026 is 18.61% vs 23.16% in Mar 2026

QoQ Growth in quarter ended Jun 2026 is 21.34% vs 17.82% in Mar 2026
Half Yearly Results Snapshot (Standalone) - Mar'26
Growth in half year ended Mar 2026 is 34.39% vs 34.93% in Sep 2025
Growth in half year ended Mar 2026 is 41.07% vs 34.04% in Sep 2025
Nine Monthly Results Snapshot (Standalone) - Dec'25
Not Applicable: The company has declared_date for only one period
Not Applicable: The company has declared_date for only one period
Annual Results Snapshot (Standalone) - Mar'26
Not Applicable: The company has declared_date for only one period
Not Applicable: The company has declared_date for only one period
About GSM Foils Ltd

Company Coordinates


