
Compare GSS Infotech with Similar Stocks
Dashboard
Weak Long Term Fundamental Strength with a -5.17% CAGR growth in Net Sales over the last 5 years
- The company has been able to generate a Return on Equity (avg) of 2.29% signifying low profitability per unit of shareholders funds
Consistent Underperformance against the benchmark over the last 3 years
Stock DNA
Computers - Software & Consulting
INR 32 Cr (Micro Cap)
17.00
20
0.00%
0.45
0.64%
0.11
Total Returns (Price + Dividend) 
Latest dividend: 1.4999999999999998 per share ex-dividend date: Dec-21-2010
Risk Adjusted Returns v/s
Returns Beta

News

GSS Infotech Ltd is Rated Sell
GSS Infotech Ltd is rated 'Sell' by MarketsMOJO, with this rating last updated on 01 June 2026. However, the analysis and financial metrics discussed here reflect the stock's current position as of 03 July 2026, providing investors with the latest insights into the company’s performance and outlook.
Read full news article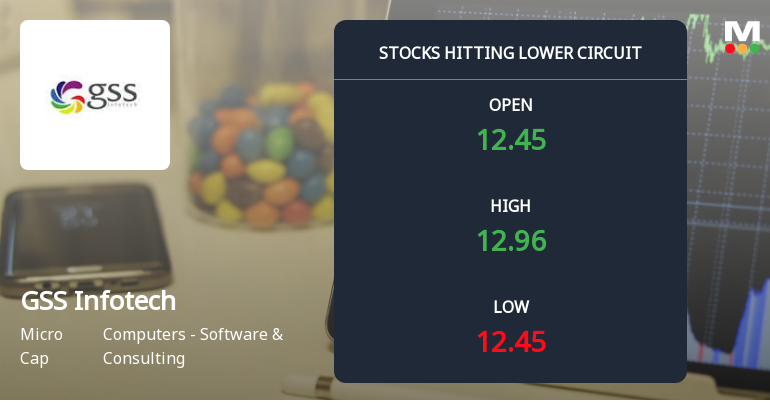
GSS Infotech Ltd Locks at Lower Circuit With 5% Loss — Sellers Queue, No Buyers in Sight
At Rs 12.45, sellers were still queuing — but there were no buyers willing to take the other side. GSS Infotech Ltd locked at its lower circuit of 5% on 25 Jun 2026, with unfilled sell orders and a frozen price.
Read full news article
GSS Infotech Ltd is Rated Sell
GSS Infotech Ltd is rated 'Sell' by MarketsMOJO, with this rating last updated on 01 June 2026. While the rating change occurred on that date, the analysis and financial metrics discussed here reflect the stock's current position as of 19 June 2026, providing investors with the latest insights into the company’s performance and outlook.
Read full news article Announcements
GSS Infotech Limited - Outcome of Board Meeting
13-Nov-2019 | Source : NSEGSS Infotech Limited has informed the Exchange regarding Board meeting held on November 12, 2019.
GSS Infotech Limited - Reply to Clarification Sought
29-Oct-2019 | Source : NSEGSS Infotech Limited has informed the Exchange reply to clarification sought in regard to price movement
AGM\/Book Closure
14-Aug-2019 | Source : NSE
| GSS Infotech Limited has informed the Exchange that the Register of Members and Share Transfer Books of the Company will remain closed from September 23, 2019 to September 30, 2019 ( both days inclusive) for the purpose of Annual General Meeting to be held to be held on September 30, 2019. |
Corporate Actions

No Upcoming Board Meetings

GSS Infotech Ltd has declared 15% dividend, ex-date: 21 Dec 10

No Splits history available

No Bonus history available

No Rights history available
Quality key factors
Valuation key factors
Technicals key factors
 Technical Indicator Scale: Bearish, Mildly Bearish, Sideways, Mildly Bullish, Bullish Turned
 Shareholding Snapshot : Dec 2025
Shareholding Compare (%holding)
Non Institution
None
Held by 0 Schemes
Held by 3 FIIs (1.03%)
Raghunada Rao Marepally (12.58%)
Alisha Sapan Shah (4.97%)
68.14%
Quarterly Results Snapshot (Consolidated) - Mar'26 - YoY

YoY Growth in quarter ended Mar 2026 is -31.00% vs 0.42% in Mar 2025
YoY Growth in quarter ended Mar 2026 is -7,021.74% vs -110.06% in Mar 2025
Half Yearly Results Snapshot (Consolidated) - Sep'25
Growth in half year ended Sep 2025 is -31.86% vs -27.95% in Sep 2024
Growth in half year ended Sep 2025 is -700.00% vs -56.25% in Sep 2024
Nine Monthly Results Snapshot (Consolidated) - Dec'25

YoY Growth in nine months ended Dec 2025 is -28.91% vs -35.20% in Dec 2024
YoY Growth in nine months ended Dec 2025 is -58.21% vs -120.36% in Dec 2024
Annual Results Snapshot (Consolidated) - Mar'26
YoY Growth in year ended Mar 2026 is -29.59% vs -26.72% in Mar 2025
YoY Growth in year ended Mar 2026 is -3,578.83% vs -118.36% in Mar 2025
About GSS Infotech Ltd

Company Coordinates


