
Compare GTL with Similar Stocks
Dashboard
With a Negative Book Value, the company has a Weak Long Term Fundamental Strength
- Poor long term growth as Net Sales has grown by an annual rate of -1.54% and Operating profit at 0% over the last 5 years
- The company has a negative book value of Rs 6,052.56 crore
Negative results in Mar 26
Risky - Negative EBITDA
97.86% of Promoter Shares are Pledged
Underperformed the market in the last 1 year
Stock DNA
Telecom - Services
INR 126 Cr (Micro Cap)
NA (Loss Making)
21
0.00%
-0.89
0.43%
-0.02
Total Returns (Price + Dividend) 
Latest dividend: 3 per share ex-dividend date: Jul-09-2010
Risk Adjusted Returns v/s
Returns Beta

News
GTL Ltd is Rated Strong Sell by MarketsMOJO
GTL Ltd is rated Strong Sell by MarketsMOJO, with this rating last updated on 17 June 2025. However, the analysis and financial metrics discussed here reflect the stock’s current position as of 15 June 2026, providing investors with the latest insights into the company’s performance and outlook.
Read full news article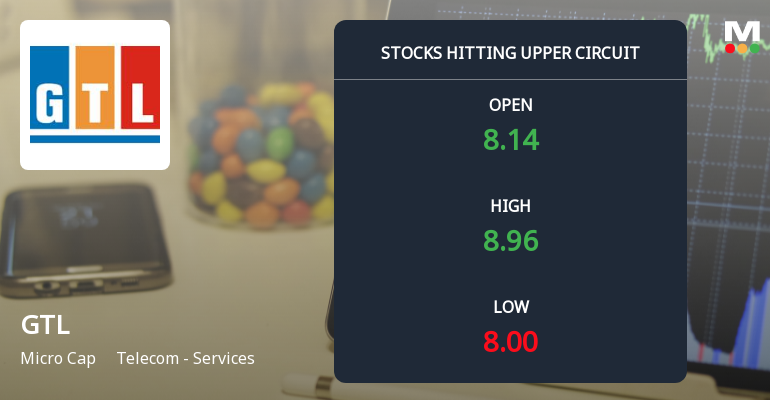
GTL Ltd Locks at Upper Circuit With 9.21% Gain — Buyers Queue, Sellers Absent
At Rs 8.95, the buying was done — not because demand dried up, but because the exchange wouldn't let the stock go any higher. GTL Ltd locked at its upper circuit of 9.21% on 8 Jun 2026, with buyers queuing and no sellers willing to part with shares.
Read full news article
GTL Ltd is Rated Strong Sell
GTL Ltd is rated Strong Sell by MarketsMOJO, with this rating last updated on 17 June 2025. However, the analysis and financial metrics discussed here reflect the company’s current position as of 01 June 2026, providing investors with an up-to-date view of its fundamentals, valuation, financial trend, and technical outlook.
Read full news article Announcements
GTL Limited - Outcome of Board Meeting
14-Nov-2019 | Source : NSEGTL Limited has informed the Exchange regarding Board meeting held on November 13, 2019.
GTL Limited - Disclosure under SEBI Takeover Regulations
09-Oct-2019 | Source : NSEDisclosure under SEBI Takeover Regulations GTL : Global Holding Corporation Pvt Ltd has informed the Exchange regarding reason for encumbrance vide letter dated October 04, 2019 under SEBI ( SAST) Regulations, 2011.
Updates
04-Sep-2019 | Source : NSE
| GTL Limited has informed the Exchange regarding 'Publication of Notice to Shareholders in Newspapers ?? AGM 2019 '. |
Corporate Actions

No Upcoming Board Meetings

GTL Ltd has declared 30% dividend, ex-date: 09 Jul 10

No Splits history available

No Bonus history available

No Rights history available
Quality key factors
Valuation key factors
Technicals key factors
 Technical Indicator Scale: Bearish, Mildly Bearish, Sideways, Mildly Bullish, Bullish Turned
 Shareholding Snapshot : Mar 2026
Shareholding Compare (%holding)
Non Institution
97.8623
Held by 0 Schemes
Held by 3 FIIs (0.01%)
Global Holding Corporation Private Limited (14.29%)
Union Bank Of India (4.8%)
70.87%
Quarterly Results Snapshot (Standalone) - Mar'26 - QoQ

QoQ Growth in quarter ended Mar 2026 is 5.91% vs -0.72% in Dec 2025
QoQ Growth in quarter ended Mar 2026 is 23,257.79% vs 93.34% in Dec 2025
Half Yearly Results Snapshot (Standalone) - Sep'25

Growth in half year ended Sep 2025 is -16.41% vs 43.31% in Sep 2024
Growth in half year ended Sep 2025 is -207.38% vs -68.59% in Sep 2024
Nine Monthly Results Snapshot (Standalone) - Dec'25
YoY Growth in nine months ended Dec 2025 is -9.70% vs 35.05% in Dec 2024
YoY Growth in nine months ended Dec 2025 is -35.27% vs -126.26% in Dec 2024
Annual Results Snapshot (Standalone) - Mar'26
YoY Growth in year ended Mar 2026 is -11.62% vs 25.73% in Mar 2025
YoY Growth in year ended Mar 2026 is 7,051.67% vs -103.98% in Mar 2025
About GTL Ltd

Company Coordinates


