
Compare GTL Infra. with Similar Stocks
Dashboard
With a Negative Book Value, the company has a Weak Long Term Fundamental Strength
- Poor long term growth as Operating profit has grown by an annual rate -35.45% of over the last 5 years
- The company has a negative book value of Rs 5,215.03 crore
Risky - Negative Book Value
100% of Promoter Shares are Pledged
Underperformed the market in the last 1 year
Stock DNA
Telecom - Equipment & Accessories
INR 1,550 Cr (Micro Cap)
NA (Loss Making)
20
0.00%
-1.11
8.03%
-0.30
Total Returns (Price + Dividend) 
GTL Infra. for the last several years.
Risk Adjusted Returns v/s
Returns Beta

News
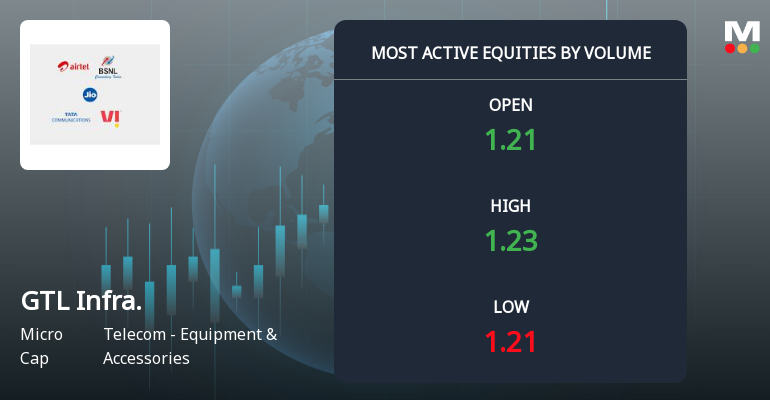
GTL Infrastructure Ltd Sees Exceptional Volume Amid Mixed Technical Signals
GTL Infrastructure Ltd (GTLINFRA), a micro-cap player in the Telecom - Equipment & Accessories sector, witnessed one of the highest trading volumes on 30 July 2026, with over 81.7 lakh shares exchanging hands. Despite this surge in activity, the stock’s price remained largely unchanged at ₹1.21, reflecting a complex interplay of accumulation and distribution signals amid a challenging technical backdrop.
Read full news article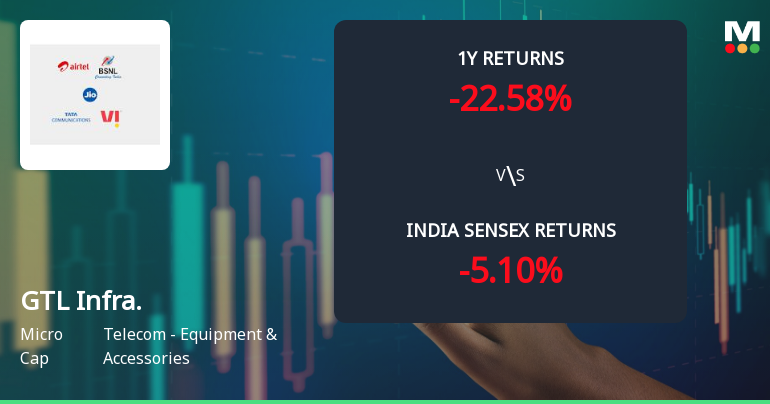
GTL Infrastructure Ltd Faces Technical Momentum Shift Amid Bearish Indicators
GTL Infrastructure Ltd, a micro-cap player in the Telecom Equipment & Accessories sector, has experienced a notable shift in its technical momentum, moving from a sideways trend to a mildly bearish stance. Recent technical indicators, including MACD, RSI, and moving averages, signal a cautious outlook for investors as the stock price continues to face downward pressure amid broader market challenges.
Read full news article
GTL Infrastructure Ltd is Rated Strong Sell
GTL Infrastructure Ltd is rated Strong Sell by MarketsMOJO, with this rating last updated on 16 July 2026. However, the analysis and financial metrics discussed here reflect the stock’s current position as of 28 July 2026, providing investors with the latest insights into the company’s performance and outlook.
Read full news article Announcements
Compliances-Certificate under Reg. 74 (5) of SEBI (DP) Regulations 2018
07-Jul-2026 | Source : BSECertificate under SEBI (Depositories and Participants) Regulations 2018 for the quarter ended June 30 2026
Closure of Trading Window
26-Jun-2026 | Source : BSETrading Window Closure period under the Securities and Exchange Board of India (Prohibition of Insider Trading) Regulations 2015
Compliances-Reg.24(A)-Annual Secretarial Compliance
30-May-2026 | Source : BSESecretarial Compliance Report for the Financial Year ended March 31 2026
Corporate Actions

No Upcoming Board Meetings

No Dividend history available

No Splits history available

No Bonus history available

GTL Infrastructure Ltd has announced 1:1 rights issue, ex-date: 20 Jul 07
Quality key factors
Valuation key factors
Technicals key factors
 Technical Indicator Scale: Bearish, Mildly Bearish, Sideways, Mildly Bullish, Bullish Turned
 Shareholding Snapshot : Jun 2026
Shareholding Compare (%holding)
Non Institution
100
Held by 2 Schemes (0.0%)
Held by 8 FIIs (0.77%)
Global Holding Corporation Private Limited (3.28%)
Union Bank Of India (12.07%)
59.9%
Quarterly Results Snapshot (Standalone) - Mar'26 - QoQ

QoQ Growth in quarter ended Mar 2026 is -5.77% vs -1.66% in Dec 2025

QoQ Growth in quarter ended Mar 2026 is 5,955.06% vs 110.12% in Dec 2025
Half Yearly Results Snapshot (Standalone) - Sep'25
Growth in half year ended Sep 2025 is 3.36% vs -4.95% in Sep 2024
Growth in half year ended Sep 2025 is -2.35% vs -52.96% in Sep 2024
Nine Monthly Results Snapshot (Standalone) - Dec'25
YoY Growth in nine months ended Dec 2025 is 3.43% vs -3.25% in Dec 2024
YoY Growth in nine months ended Dec 2025 is 35.12% vs -34.21% in Dec 2024
Annual Results Snapshot (Standalone) - Mar'26
YoY Growth in year ended Mar 2026 is 2.08% vs -2.04% in Mar 2025
YoY Growth in year ended Mar 2026 is 189.04% vs -28.44% in Mar 2025
About GTL Infrastructure Ltd

Company Coordinates


