
Compare GTT Data with Similar Stocks
Dashboard
With a Operating Losses, the company has a Weak Long Term Fundamental Strength
- Poor long term growth as Operating profit has grown by an annual rate -306.88% of over the last 5 years
- Low ability to service debt as the company has a high Debt to EBITDA ratio of -12.36 times
Flat results in Mar 26
Risky - Negative EBITDA
Underperformed the market in the last 1 year
Stock DNA
Media & Entertainment
INR 155 Cr (Micro Cap)
NA (Loss Making)
20
0.00%
0.42
-22.68%
1.97
Total Returns (Price + Dividend) 
GTT Data for the last several years.
Risk Adjusted Returns v/s
Returns Beta

News

Markets Rally, But GTT Data Solutions Ltd Sinks to 52-Week Low in Stock-Specific Sell-Off
Despite a broadly positive market backdrop, GTT Data Solutions Ltd has plunged to a fresh 52-week low of Rs 39.3 on 10 Jun 2026, marking a steep 48.63% decline over the past year and underperforming the Sensex by a wide margin.
Read full news article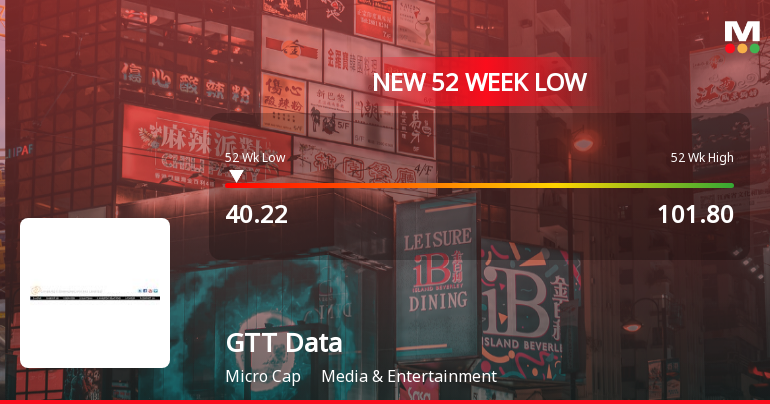
Markets Rally, But GTT Data Solutions Ltd Sinks to 52-Week Low in Stock-Specific Sell-Off
While the broader market showed signs of recovery, GTT Data Solutions Ltd endured a sharp decline, hitting a fresh 52-week low of Rs 41 on 8 Jun 2026. This drop comes despite a brief two-day rally, underscoring persistent headwinds for the micro-cap media and entertainment company.
Read full news article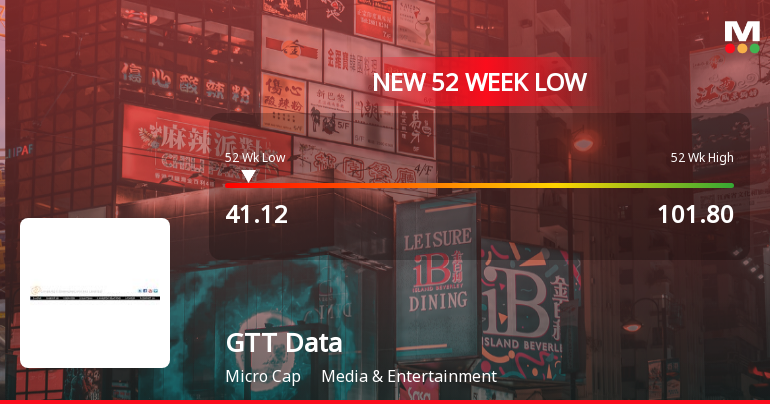
Announcements
Announcement under Regulation 30 (LODR)-Change in Management
09-Jun-2026 | Source : BSEAppointment of Mr. Charudatta Palwe as an Independent Director of the Company.
Announcement under Regulation 30 (LODR)-Cessation
04-Jun-2026 | Source : BSEAdditional Information in relation to Disclosure dated 02 June 2026 under Regulation 30 of the SEBI (LODR) Regulation 2015 - Vacation of Office of Independent Director.
Announcement under Regulation 30 (LODR)-Cessation
02-Jun-2026 | Source : BSEVacation of Office of a Director u/s 167 (1) (b).
Corporate Actions

No Upcoming Board Meetings

No Dividend history available

No Splits history available

No Bonus history available

GTT Data Solutions Ltd has announced 1:1 rights issue, ex-date: 14 Jan 25
Quality key factors
Valuation key factors
Technicals key factors
 Technical Indicator Scale: Bearish, Mildly Bearish, Sideways, Mildly Bullish, Bullish Turned
 Shareholding Snapshot : Mar 2026
Shareholding Compare (%holding)
Promoters
None
Held by 1 Schemes (0.01%)
Held by 1 FIIs (0.0%)
U.g.patwardhan Services Pvt.ltd. (17.71%)
Vijay Mukund Jog (2.49%)
24.74%
Quarterly Results Snapshot (Consolidated) - Mar'26 - QoQ

QoQ Growth in quarter ended Mar 2026 is -31.27% vs 14.63% in Dec 2025
QoQ Growth in quarter ended Mar 2026 is -419.59% vs -84.76% in Dec 2025
Half Yearly Results Snapshot (Standalone) - Sep'25

Growth in half year ended Sep 2025 is 4,766.67% vs 0.00% in Sep 2024
Growth in half year ended Sep 2025 is -195.24% vs -4,100.00% in Sep 2024
Nine Monthly Results Snapshot (Standalone) - Dec'25
YoY Growth in nine months ended Dec 2025 is 1,006.62% vs 0.00% in Dec 2024
YoY Growth in nine months ended Dec 2025 is -38.31% vs -8,200.00% in Dec 2024
Annual Results Snapshot (Consolidated) - Mar'26
YoY Growth in year ended Mar 2026 is 726.53% vs 16.21% in Mar 2025
YoY Growth in year ended Mar 2026 is -135.01% vs -424.81% in Mar 2025
About GTT Data Solutions Ltd

Company Coordinates


