GTV Engineering

  • Market Cap: Micro Cap
  • Industry: Industrial Manufacturing
  • ISIN: INE910R01024
  • NSEID:
  • BSEID: 539479
INR
67.07
-1.2 (-1.76%)
BSENSE

Aug 04, 03:30 PM

BSE+NSE Vol: 21.59 k

  • Price Points
  • Score
  • Mojo Parameters
  • Total Return
  • News and Corporate Actions
  • Key factors
  • Shareholding
  • Financials
  • CompanyCV
stock-summaryPrice Point
High/Low

1Day

52 Week

Valuation
Technical
Day's Volume

CASH

21.59 k (-4.23%) Volume

Shareholding (Jun 2026)

FII

0.04%

Held by 1 FIIs

DII

0.01%

Held by 0 DIIs

Promoter

57.88%

Why is GTV Engineering Ltd falling/rising?

04-Aug-2026

As of 03-Aug, GTV Engineering Ltd's stock price is currently at 68.27, reflecting a recent increase after two days of decline. Despite a year-to-date gain of 24.35%, there are concerns about declining investor participation and mixed performance over shorter periods.

As of 03-Aug, GTV Engineering Ltd's stock price is rising, currently at 68.27, reflecting an increase of 1.19 or 1.77%. This upward movement follows a trend reversal after two consecutive days of decline. The stock reached an intraday high of Rs 69.5, indicating a daily increase of 3.61%. <BR><BR>Despite the recent rise, the stock has shown mixed performance over various periods. Over the past week, it has decreased by 1.60%, and over the past month, it has fallen by 9.22%. However, year-to-date, the stock has performed well, with a gain of 24.35%, contrasting with a decline of 7.72% in the Sensex. <BR><BR>The stock's current performance is described as inline with the sector, but there is a notable decrease in investor participation, with delivery volume dropping by 39.48% against the 5-day average. This suggests that while the stock is experiencing a short-term rise, there are underlying concerns regarding trading activity and investor interest. <BR><BR>On a positive note, GTV Engineering Ltd boasts high management efficiency, evidenced by a return on equity (ROE) of 15.63%, and a low debt-to-equity ratio of 0.08. Additionally, the company has demonstrated healthy long-term growth, with operating profit increasing at an annual rate of 78.44%. These factors contribute to the stock's potential for stability and growth, despite the recent fluctuations in its price.

View full answer

What does GTV Engineering do?

11-Jun-2026

GTV Engineering Ltd is a diversified industrial manufacturing company specializing in heavy engineering, hydro power generation, and flour milling. As of March 2026, it reported net sales of 32 Cr and a net profit of 3 Cr, with a market cap of INR 399 Cr.

Overview:<BR>GTV Engineering Ltd is a multi-diversified group operating in the industrial manufacturing sector, specializing in heavy engineering, hydro power generation, and flour milling.<BR><BR>History:<BR>GTV Engineering Limited was incorporated on December 4, 1990. The latest quarterly results reported are for March 2026, showing net sales and profit figures.<BR><BR>Financial Snapshot:<BR>Net Sales: 32 Cr (Quarterly Results - Mar 2026) <BR>Net Profit: 3 Cr (Quarterly Results - Mar 2026) <BR>Market Cap: INR 399 Cr (Micro Cap)<BR><BR>Key Metrics:<BR>P/E: 28.00 <BR>Industry P/E: 35 <BR>Dividend Yield: 0.12% <BR>Debt-Equity: 0.03 <BR>Return on Equity: 23.29% <BR>Price to Book: 6.40 <BR><BR>Contact Details:<BR>Address: Plot No 216-217-218 Mandideep, New Industrial Area - II Bhopal Madhya Pradesh : 462046 <BR>Tel: 91-7480-233309/401044 <BR>Email: mail@gtv.co.in <BR>Website: http://www.gtv.co.in

View full answer

How big is GTV Engineering?

11-Jun-2026

As of 10th June, GTV Engineering Ltd has a market capitalization of 399.00 Cr, with recent Net Sales of 101.51 Cr and a Net Profit of 14.21 Cr. Shareholder's Funds are 47.27 Cr and Total Assets amount to 71.34 Cr as of March 2025.

As of 10th June, GTV Engineering Ltd has a market capitalization of 399.00 Cr, categorizing it as a Micro Cap company.<BR><BR>In the latest four quarters, GTV Engineering reported Net Sales of 101.51 Cr and a Net Profit of 14.21 Cr.<BR><BR>The latest annual period for the balance sheet is March 2025, with Shareholder's Funds amounting to 47.27 Cr and Total Assets of 71.34 Cr.

View full answer

Who are in the management team of GTV Engineering?

11-Jun-2026

The management team of GTV Engineering includes Mahesh Chand Agrawal (Chairman & Managing Director), Gaurav Agrawal (Director), Darshana Agrawal (Whole-time Director), and three Independent Directors: Sham Sarup Kohli, Mukesh Metho, and Rahul Gupta, along with Ankit Rohit (Company Secretary & Compliance Officer).

The management team of GTV Engineering includes the following individuals:<BR><BR>1. Mahesh Chand Agrawal - Chairman & Managing Director<BR>2. Gaurav Agrawal - Director<BR>3. Sham Sarup Kohli - Independent Director<BR>4. Darshana Agrawal - Whole-time Director<BR>5. Ankit Rohit - Company Secretary & Compliance Officer<BR>6. Mukesh Metho - Independent Director<BR>7. Rahul Gupta - Independent Director<BR><BR>If you need more details about their roles or contributions, feel free to ask!

View full answer

Who are the peers of the GTV Engineering?

11-Jun-2026

GTV Engineering's peers include Sunita Tools Ltd, Fluidomat, Hercules Investm, Kalyani Cast-Tec, Bemco Hydraulics, Batliboi, Stovec Inds., Cospower Engine., and Josts Engg. Co. In terms of management risk, GTV Engineering has a good rating, with notable peers like Fluidomat showing excellent management risk and growth.

Peers: The peers of GTV Engineering are Sunita Tools Ltd, Fluidomat, Hercules Investm, Kalyani Cast-Tec, Bemco Hydraulics, Batliboi, Stovec Inds., Cospower Engine., and Josts Engg. Co.<BR><BR>Quality Snapshot: Excellent management risk is observed at Fluidomat, while Good management risk is found at GTV Engineering, Kalyani Cast-Tec, and Stovec Inds., and Average management risk is present at Sunita Tools Ltd, Bemco Hydraulics, Batliboi, Cospower Engine., and Josts Engg. Co. Excellent growth is noted at Fluidomat and Sunita Tools Ltd, while Good growth is seen at GTV Engineering, Kalyani Cast-Tec, and Megatherm Indu, and Below Average growth is found at Hercules Investm, Bemco Hydraulics, Batliboi, Stovec Inds., and Josts Engg. Co. Excellent capital structure is attributed to Fluidomat, GTV Engineering, and Kalyani Cast-Tec, while Good capital structure is observed at Sunita Tools Ltd, Hercules Investm, and Megatherm Indu, and Average capital structure is noted at Bemco Hydraulics, Batliboi, Cospower Engine., and Josts Engg. Co.<BR><BR>Return Snapshot: Cospower Engine. has the highest 1-year return at 154.43%, while Hercules Investm has the lowest at -41.87%. GTV Engineering's 1-year return is 8.16%, which is significantly higher than Hercules Investm but lower than Cospower Engine. Additionally, the six-month returns are negative for Bemco Hydraulics, Batliboi, and Josts Engg. Co.

View full answer

Are GTV Engineering Ltd latest results good or bad?

20-May-2026

GTV Engineering Ltd's latest results show strong revenue growth with net sales up 42.74% year-on-year, but profitability has declined significantly, with net profit down 27.70% and operating margins falling to 12.39%. Investors should be cautious due to these profitability concerns despite the revenue increase.

GTV Engineering Ltd's latest results for Q4 FY26 present a mixed picture. On one hand, the company achieved impressive revenue growth, with net sales reaching ₹31.96 crores, marking an 11.94% increase quarter-on-quarter and a substantial 42.74% increase year-on-year. This indicates strong demand and successful scaling of operations.<BR><BR>However, the profitability aspect raises concerns. The net profit fell to ₹3.11 crores, down 27.70% from the previous quarter and 27.67% year-on-year. Operating margins also plummeted from 27.64% in Q3 FY26 to just 12.39%, representing a significant decline in profitability. This margin compression suggests potential challenges in cost management or pricing power, which could impact the sustainability of the company's growth.<BR><BR>Overall, while GTV Engineering has demonstrated strong revenue growth, the sharp decline in profitability and operating margins indicates underlying issues that need to be addressed. Investors may want to approach the situation with caution, keeping an eye on how the company manages these challenges in the upcoming quarters.

View full answer

Should I buy, sell or hold GTV Engineering Ltd?

20-May-2026

Is GTV Engineering overvalued or undervalued?

28-Oct-2025

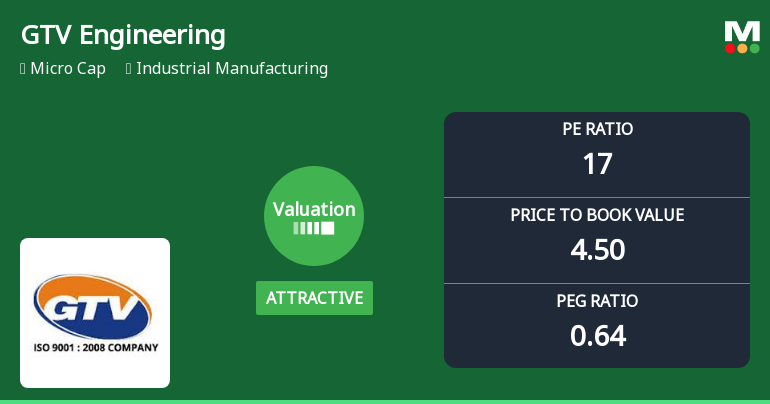
As of October 27, 2025, GTV Engineering is considered overvalued with a PE ratio of 24.75 and an EV to EBITDA ratio of 16.48, despite a significant 156.51% return over the past year, indicating a valuation grade of expensive compared to peers.

As of 27 October 2025, GTV Engineering's valuation grade has moved from very expensive to expensive, indicating a slight improvement in its perceived value. The company is currently considered overvalued based on its financial ratios. The PE ratio stands at 24.75, while the EV to EBITDA ratio is 16.48, both of which are high relative to industry norms. Additionally, the PEG ratio is notably low at 0.18, suggesting that growth expectations may not justify the current price.<BR><BR>When comparing GTV Engineering to its peers, Rail Vikas has a significantly higher PE ratio of 57.73, while Ircon International, which is rated attractive, has a PE of 23.95. This highlights that GTV's valuation is on the higher side compared to some competitors, despite being lower than the most expensive peers like Tube Investments and Craftsman Auto. Furthermore, GTV Engineering has outperformed the Sensex significantly over the past year, with a return of 156.51% compared to the Sensex's 6.77%, which may contribute to the perception of overvaluation.

View full answer

How has been the historical performance of GTV Engineering?

15-Oct-2025

GTV Engineering's historical performance shows fluctuating net sales, peaking at 120.62 Cr in March 2024 before declining to 102.77 Cr in March 2025, while profitability metrics improved, with profit after tax rising from 5.41 Cr to 11.05 Cr in the same period. Despite challenges in sales and total assets, the company demonstrated enhanced operational efficiency and reduced liabilities.

Answer:<BR>The historical performance of GTV Engineering shows a fluctuating trend in net sales and profitability over the years.<BR><BR>Breakdown:<BR>GTV Engineering's net sales peaked at 120.62 Cr in March 2024 but declined to 102.77 Cr by March 2025. The total operating income followed a similar pattern, reaching 120.62 Cr in March 2024 and dropping to 102.77 Cr in March 2025. The raw material costs were significantly high at 107.59 Cr in March 2024, which decreased to 77.51 Cr in March 2025. Operating profit, excluding other income, saw a notable increase from 5.44 Cr in March 2024 to 16.16 Cr in March 2025, indicating improved operational efficiency. Profit before tax also rose from 6.80 Cr in March 2024 to 15.21 Cr in March 2025, leading to a profit after tax of 11.05 Cr in March 2025, up from 5.41 Cr in the previous year. The company's total liabilities decreased from 75.82 Cr in March 2024 to 71.34 Cr in March 2025, while total assets also saw a decline from 75.82 Cr to 71.34 Cr in the same period. Cash flow from operating activities was positive at 2.00 Cr in March 2025, although the net cash outflow was -7.00 Cr, reflecting challenges in financing activities. Overall, GTV Engineering has shown improvements in profitability metrics despite fluctuations in sales and total assets.

View full answer

When is the next results date for GTV Engineering?

06-Aug-2025

GTV Engineering will announce its results on 12 August 2025.

GTV Engineering will declare its results on 12 August 2025.

View full answer

Who are the top shareholders of the GTV Engineering?

17-Jul-2025

The top shareholder of GTV Engineering is Mahesh Agrawal, holding 39.43% of the shares, with no pledged promoter holdings. The highest public shareholder is Rohit D Gupta at 3.38%, while individual investors collectively own 32.64%.

The top shareholders of GTV Engineering include the promoters, with Mahesh Agrawal holding the largest share at 39.43%. There are no pledged promoter holdings, and the company does not have any mutual funds or foreign institutional investors (FIIs) holding shares. The highest public shareholder is Rohit D Gupta, who owns 3.38%. Additionally, individual investors collectively hold 32.64% of the shares.

View full answer

What is the technical trend for GTV Engineering?

09-Jun-2025

As of May 30, 2025, GTV Engineering's technical trend is bullish, supported by positive MACD and moving averages, despite bearish RSI readings and mixed signals from KST.

As of 30 May 2025, the technical trend for GTV Engineering has changed from mildly bullish to bullish. The weekly and monthly MACD indicators are both bullish, supporting a positive outlook. Bollinger Bands also indicate bullish conditions on both time-frames. However, the RSI readings are bearish on both the weekly and monthly charts, suggesting potential overbought conditions. Daily moving averages are bullish, reinforcing the overall positive trend. Dow Theory confirms a bullish stance on both weekly and monthly levels. Despite some mixed signals from the KST, which is mildly bearish on both weekly and monthly, the overall technical stance remains bullish, driven primarily by the strong MACD and moving averages.

View full answer

Has GTV Engineering declared dividend?

06-Jun-2025

GTV Engineering Ltd has declared a 5% dividend, amounting to 0.5 per share, with an ex-date of February 5, 2025. The company has shown impressive total returns over various periods, including a 702.09% total return over three years.

GTV Engineering Ltd has declared a 5% dividend.<BR><BR>Dividend Details:<BR>- Percentage announced: 5%<BR>- Amount per share: 0.5<BR>- Ex-date: Feb-05-2025<BR><BR>Dividend Yield: 0.05%<BR><BR>Total Returns by Period:<BR>In the 6-month period, GTV Engineering achieved a price return of 92.18%, a dividend return of 0.09%, resulting in a total return of 92.27%.<BR><BR>For the 1-year period, the company recorded a price return of 136.88%, a dividend return of 0.10%, leading to a total return of 136.98%.<BR><BR>Over the 2-year period, GTV Engineering saw a price return of 180.62%, a dividend return of 0.16%, culminating in a total return of 180.78%.<BR><BR>In the 3-year period, the price return was 701.69%, with a dividend return of 0.40%, resulting in a total return of 702.09%.<BR><BR>During the 4-year period, the company experienced a price return of 4240.83%, a dividend return of 2.27%, which brought the total return to 4243.1%.<BR><BR>For the 5-year period, GTV Engineering achieved a price return of 4479.34%, a dividend return of 2.53%, leading to a total return of 4481.87%.<BR><BR>Overall, GTV Engineering has declared a dividend while also demonstrating substantial total returns across various periods, indicating strong financial performance and shareholder value enhancement.

View full answer
iScoreScore
Click here to find our call on this stock
Strong Sell
Sell
Hold
Buy
Strong Buy

Dashboard

1

High Management Efficiency with a high ROE of 15.63%

 
2

Company has a Debt to Equity ratio (avg) of 0.08 times

 
3

Healthy long term growth as Operating profit has grown by an annual rate 78.44%

 
4

Flat results in Mar 26

5

With ROE of 23.3, it has a Expensive valuation with a 5.7 Price to Book Value

6

Majority shareholders : Promoters

 
7

Underperformed the market in the last 1 year

stock-summaryMojo Parameters

Mojo Parameters

Loading Valuation Snapshot...

Stock DNA

stock-summary
Industry

Industrial Manufacturing

stock-summary
Market cap

INR 345 Cr (Micro Cap)

stock-summary
P/E

24.00

stock-summary
Industry P/E

36

stock-summary
Dividend Yield

0.14%

stock-summary
Debt Equity

0.03

stock-summary
Return on Equity

23.29%

stock-summary
Price to Book

5.68

Revenue and Profits:
Net Sales:
32 Cr
(Quarterly Results - Mar 2026)
Net Profit:
3 Cr
stock-summaryTotal Returns
Total Returns (Price + Dividend) stock-summary
Dividend Yield (0.14%)
TimePeriod
Price Return
Dividend Return
Total Return
3 Months
-4.23%
0%
-4.23%
6 Months
31.9%
0%
31.9%
1 Year
-21.77%
0.13%
-21.64%
2 Years
129.61%
0.44%
130.05%
3 Years
149.24%
0.59%
149.83%
4 Years
396.81%
0.84%
397.65%
5 Years
2766.24%
6.03%
2772.27%

Latest dividend: 0.1 per share ex-dividend date: Sep-22-2025

Risk Adjusted Returns v/s stock-summary
Returns Beta
Icon
Beta has not been calculated since enough price history is not available
stock-summaryNews & Corporate Actions

Announcements stock-summary

Compliances-Certificate under Reg. 74 (5) of SEBI (DP) Regulations 2018

07-Jul-2026 | Source : BSE

Compliance Certificate Under Reg 74(5) of SEBI (DP) Regulations 2018.

Closure of Trading Window

29-Jun-2026 | Source : BSE

Intimation regarding closure of Trading Window.

Update On Institutional Investors Meeting.

08-Jun-2026 | Source : BSE

Update on Institutional Investors Meeting.

Corporate Actions stock-summary

stock-summary
BOARD MEETING

No Upcoming Board Meetings

stock-summary
DIVIDEND

GTV Engineering Ltd has declared 5% dividend, ex-date: 22 Sep 25

stock-summary
SPLITS

GTV Engineering Ltd has announced 2:10 stock split, ex-date: 28 Jul 25

stock-summary
BONUS

GTV Engineering Ltd has announced 2:1 bonus issue, ex-date: 28 Jul 25

stock-summary
RIGHTS

No Rights history available

stock-summaryKey Factors

Quality key factors stock-summary

Factor
Value
Sales Growth (5y)
12.07%
EBIT Growth (5y)
78.44%
EBIT to Interest (avg)
7.92
Debt to EBITDA (avg)
1.07
Net Debt to Equity (avg)
0.03
Sales to Capital Employed (avg)
2.21
Tax Ratio
25.98%
Dividend Payout Ratio
8.48%
Pledged Shares
0
Institutional Holding
0.05%
ROCE (avg)
15.70%
ROE (avg)
15.63%

Valuation key factors

Factor
Value
P/E Ratio
24
Industry P/E
36
Price to Book Value
5.66
EV to EBIT
19.85
EV to EBITDA
18.88
EV to Capital Employed
5.53
EV to Sales
3.42
PEG Ratio
1.31
Dividend Yield
0.14%
ROCE (Latest)
27.89%
ROE (Latest)
23.29%

Technicals key factors

Indicator
Weekly
Monthly
MACD
Mildly Bearish
Mildly Bearish
RSI
No Signal
No Signal
Bollinger Bands
Mildly Bearish
Bullish
Moving Averages
Mildly Bullish (Daily)
KST
Mildly Bearish
Mildly Bearish
Dow Theory
No Trend
No Trend
stock-summary Technical Indicator Scale: Bearish, Mildly Bearish, Sideways, Mildly Bullish, Bullish  Turned 
stock-summaryShareholding
Shareholding Snapshot : Jun 2026stock-summary
Shareholding Compare (%holding) stock-summary
Majority shareholders

Promoters

Pledged Promoter Holdings

None

Mutual Funds

Held by 0 Schemes

FIIs

Held by 1 FIIs (0.04%)

Promoter with highest holding

Mahesh Agrawal (35.53%)

Highest Public shareholder

Rohit Dharampal Gupta (3.38%)

Individual Investors Holdings

32.37%

stock-summaryFinancial
[
  {
    "link": "quarterly",
    "btn_text": "All Quarterly Results",
    "header": "Quarterly Results Snapshot (Standalone) - Mar'26 - YoY",
    "rhs": [
      {
        "prefix": "Net Sales ",
        "suffix": "YoY Growth in quarter ended Mar 2026 is 42.74% vs -30.18% in Mar 2025",
        "dir": 1
      },
      {
        "prefix": "Standalone Net Profit ",
        "suffix": "YoY Growth in quarter ended Mar 2026 is -27.67% vs 84.55% in Mar 2025",
        "dir": -1
      }
    ],
    "table": {
      "header": [
        "Mar'26",
        "Mar'25",
        "Change(%)"
      ],
      "body": [
        {
          "field": "Net Sales",
          "val1": "31.96",
          "val2": "22.39",
          "chgp": "42.74%",
          "chgp_class": "positive"
        },
        {
          "field": "Operating Profit (PBDIT) excl Other Income",
          "val1": "3.96",
          "val2": "6.35",
          "chgp": "-37.64%",
          "chgp_class": "negative"
        },
        {
          "field": "Interest",
          "val1": "0.02",
          "val2": "0.01",
          "chgp": "100.00%",
          "chgp_class": "negative"
        },
        {
          "field": "Exceptional Items",
          "val1": "0.00",
          "val2": "0.00",
          "chgp": "",
          "chgp_class": "neutral"
        },
        {
          "field": "Standalone Net Profit",
          "val1": "3.11",
          "val2": "4.30",
          "chgp": "-27.67%",
          "chgp_class": "negative"
        },
        {
          "field": "Operating Profit Margin (Excl OI)",
          "val1": "12.39%",
          "val2": "28.36%",
          "chgp": "-15.97%",
          "chgp_class": "negative"
        }
      ]
    }
  },
  {
    "link": "half-yearly",
    "btn_text": "All Half Yearly Results",
    "header": "Half Yearly Results Snapshot (Standalone) - Sep'25",
    "rhs": [
      {
        "prefix": "Net Sales ",
        "suffix": " Growth in half year ended Sep 2025 is -27.08% vs -11.42% in Sep 2024",
        "dir": -1
      },
      {
        "prefix": "Standalone Net Profit ",
        "suffix": " Growth in half year ended Sep 2025 is 122.22% vs 82.61% in Sep 2024",
        "dir": 1
      }
    ],
    "table": {
      "header": [
        "Sep'25",
        "Sep'24",
        "Change(%)"
      ],
      "body": [
        {
          "field": "Net Sales",
          "val1": "41.01",
          "val2": "56.24",
          "chgp": "-27.08%",
          "chgp_class": "negative"
        },
        {
          "field": "Operating Profit (PBDIT) excl Other Income",
          "val1": "6.53",
          "val2": "4.09",
          "chgp": "59.66%",
          "chgp_class": "positive"
        },
        {
          "field": "Interest",
          "val1": "0.04",
          "val2": "0.23",
          "chgp": "-82.61%",
          "chgp_class": "positive"
        },
        {
          "field": "Exceptional Items",
          "val1": "0.00",
          "val2": "0.00",
          "chgp": "",
          "chgp_class": "neutral"
        },
        {
          "field": "Standalone Net Profit",
          "val1": "5.60",
          "val2": "2.52",
          "chgp": "122.22%",
          "chgp_class": "positive"
        },
        {
          "field": "Operating Profit Margin (Excl OI)",
          "val1": "15.92%",
          "val2": "7.27%",
          "chgp": "8.65%",
          "chgp_class": "positive"
        }
      ]
    }
  },
  {
    "link": "nine-monthly",
    "btn_text": "All Nine Monthly Results",
    "header": "Nine Monthly Results Snapshot (Standalone) - Dec'25",
    "rhs": [
      {
        "prefix": "Net Sales ",
        "suffix": "YoY Growth in nine months ended Dec 2025 is -13.46% vs -9.23% in Dec 2024",
        "dir": -1
      },
      {
        "prefix": "Standalone Net Profit ",
        "suffix": "YoY Growth in nine months ended Dec 2025 is 64.59% vs 119.16% in Dec 2024",
        "dir": -1
      }
    ],
    "table": {
      "header": [
        "Dec'25",
        "Dec'24",
        "Change(%)"
      ],
      "body": [
        {
          "field": "Net Sales",
          "val1": "69.56",
          "val2": "80.38",
          "chgp": "-13.46%",
          "chgp_class": "negative"
        },
        {
          "field": "Operating Profit (PBDIT) excl Other Income",
          "val1": "14.42",
          "val2": "9.82",
          "chgp": "46.84%",
          "chgp_class": "positive"
        },
        {
          "field": "Interest",
          "val1": "0.06",
          "val2": "0.26",
          "chgp": "-76.92%",
          "chgp_class": "positive"
        },
        {
          "field": "Exceptional Items",
          "val1": "0.00",
          "val2": "0.00",
          "chgp": "",
          "chgp_class": "neutral"
        },
        {
          "field": "Standalone Net Profit",
          "val1": "11.11",
          "val2": "6.75",
          "chgp": "64.59%",
          "chgp_class": "positive"
        },
        {
          "field": "Operating Profit Margin (Excl OI)",
          "val1": "20.73%",
          "val2": "12.22%",
          "chgp": "8.51%",
          "chgp_class": "positive"
        }
      ]
    }
  },
  {
    "link": "annual",
    "btn_text": "All Annual Results",
    "header": "Annual Results Snapshot (Standalone) - Mar'26",
    "rhs": [
      {
        "prefix": "Net Sales ",
        "suffix": "YoY Growth in year ended Mar 2026 is -1.22% vs -14.80% in Mar 2025",
        "dir": 1
      },
      {
        "prefix": "Standalone Net Profit ",
        "suffix": "YoY Growth in year ended Mar 2026 is 28.69% vs 104.25% in Mar 2025",
        "dir": -1
      }
    ],
    "table": {
      "header": [
        "Mar'26",
        "Mar'25",
        "Change(%)"
      ],
      "body": [
        {
          "field": "Net Sales",
          "val1": "101.52",
          "val2": "102.77",
          "chgp": "-1.22%",
          "chgp_class": "negative"
        },
        {
          "field": "Operating Profit (PBDIT) excl Other Income",
          "val1": "18.38",
          "val2": "16.16",
          "chgp": "13.74%",
          "chgp_class": "positive"
        },
        {
          "field": "Interest",
          "val1": "0.08",
          "val2": "0.28",
          "chgp": "-71.43%",
          "chgp_class": "positive"
        },
        {
          "field": "Exceptional Items",
          "val1": "0.00",
          "val2": "0.00",
          "chgp": "",
          "chgp_class": "neutral"
        },
        {
          "field": "Standalone Net Profit",
          "val1": "14.22",
          "val2": "11.05",
          "chgp": "28.69%",
          "chgp_class": "positive"
        },
        {
          "field": "Operating Profit Margin (Excl OI)",
          "val1": "18.10%",
          "val2": "15.72%",
          "chgp": "2.38%",
          "chgp_class": "positive"
        }
      ]
    }
  }
]

Quarterly Results Snapshot (Standalone) - Mar'26 - YoYstock-summary

Mar'26
Mar'25
Change(%)
Net Sales
31.96
22.39
42.74%
Operating Profit (PBDIT) excl Other Income
3.96
6.35
-37.64%
Interest
0.02
0.01
100.00%
Exceptional Items
0.00
0.00
Standalone Net Profit
3.11
4.30
-27.67%
Operating Profit Margin (Excl OI)
12.39%
28.36%
-15.97%
Values in Rs Cr.
Direction Arrows
Net Sales

YoY Growth in quarter ended Mar 2026 is 42.74% vs -30.18% in Mar 2025

Direction Arrows
Standalone Net Profit

YoY Growth in quarter ended Mar 2026 is -27.67% vs 84.55% in Mar 2025

Half Yearly Results Snapshot (Standalone) - Sep'25stock-summary

Sep'25
Sep'24
Change(%)
Net Sales
41.01
56.24
-27.08%
Operating Profit (PBDIT) excl Other Income
6.53
4.09
59.66%
Interest
0.04
0.23
-82.61%
Exceptional Items
0.00
0.00
Standalone Net Profit
5.60
2.52
122.22%
Operating Profit Margin (Excl OI)
15.92%
7.27%
8.65%
Values in Rs Cr.
Direction Arrows
Net Sales

Growth in half year ended Sep 2025 is -27.08% vs -11.42% in Sep 2024

Direction Arrows
Standalone Net Profit

Growth in half year ended Sep 2025 is 122.22% vs 82.61% in Sep 2024

Nine Monthly Results Snapshot (Standalone) - Dec'25stock-summary

Dec'25
Dec'24
Change(%)
Net Sales
69.56
80.38
-13.46%
Operating Profit (PBDIT) excl Other Income
14.42
9.82
46.84%
Interest
0.06
0.26
-76.92%
Exceptional Items
0.00
0.00
Standalone Net Profit
11.11
6.75
64.59%
Operating Profit Margin (Excl OI)
20.73%
12.22%
8.51%
Values in Rs Cr.
Direction Arrows
Net Sales

YoY Growth in nine months ended Dec 2025 is -13.46% vs -9.23% in Dec 2024

Direction Arrows
Standalone Net Profit

YoY Growth in nine months ended Dec 2025 is 64.59% vs 119.16% in Dec 2024

Annual Results Snapshot (Standalone) - Mar'26stock-summary

Mar'26
Mar'25
Change(%)
Net Sales
101.52
102.77
-1.22%
Operating Profit (PBDIT) excl Other Income
18.38
16.16
13.74%
Interest
0.08
0.28
-71.43%
Exceptional Items
0.00
0.00
Standalone Net Profit
14.22
11.05
28.69%
Operating Profit Margin (Excl OI)
18.10%
15.72%
2.38%
Values in Rs Cr.
Direction Arrows
Net Sales

YoY Growth in year ended Mar 2026 is -1.22% vs -14.80% in Mar 2025

Direction Arrows
Standalone Net Profit

YoY Growth in year ended Mar 2026 is 28.69% vs 104.25% in Mar 2025

stock-summaryCompany CV
About GTV Engineering Ltd stock-summary
stock-summary
GTV Engineering Ltd
Micro Cap
Industrial Manufacturing
GTV Engineering Limited was established on December 4, 1990. GTV is a multi-diversified group with business interests in heavy engineering, hydro power generation and flour milling business. The major business is a Hi-Tech Heavy Steel Fabrication & Machining Company working as sub-contractors for various Giant Engineering companies like BHEL, SIEMENS, HOWDEN, XYLEM, etc.
Company Coordinates stock-summary
Company Details
Plot No 216-217-218 Mandideep, New Industrial Area - II Bhopal Madhya Pradesh : 462046
stock-summary
Tel: 91-7480-233309/401044
stock-summary
mail@gtv.co.in
Registrar Details
Ankit Consultancy Pvt Ltd, Plot No 60, Electronic Complex, Pardeshipura, Indore