
Compare Guj Apollo Inds with Similar Stocks
Dashboard
With a Operating Losses, the company has a Weak Long Term Fundamental Strength
- Company's ability to service its debt is weak with a poor EBIT to Interest (avg) ratio of -4.36
- The company has reported losses. Due to this company has reported negative ROCE
Risky - Negative EBITDA
Underperformed the market in the last 1 year
Stock DNA
Industrial Manufacturing
INR 460 Cr (Micro Cap)
76.00
44
0.52%
0.08
1.17%
0.89
Total Returns (Price + Dividend) 
Latest dividend: 2 per share ex-dividend date: Sep-23-2025
Risk Adjusted Returns v/s
Returns Beta

News
Gujarat Apollo Industries Ltd is Rated Strong Sell
Gujarat Apollo Industries Ltd is rated Strong Sell by MarketsMOJO. This rating was last updated on 18 May 2026, reflecting a significant reassessment of the stock’s outlook. However, all fundamentals, returns, and financial metrics discussed below are current as of 13 July 2026, providing investors with the latest perspective on the company’s position.
Read full news article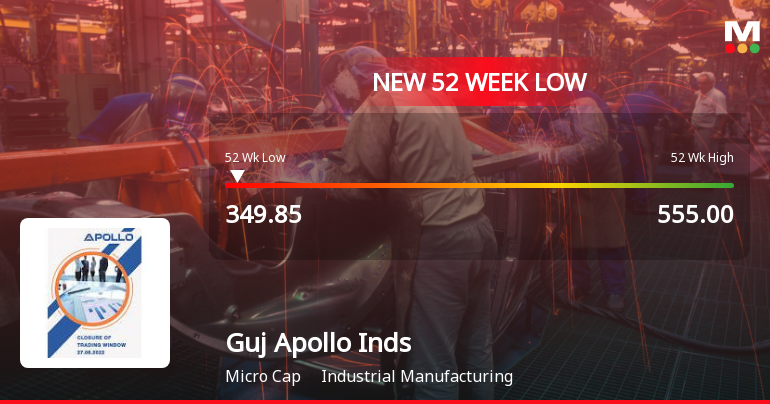
Markets Rally, But Gujarat Apollo Industries Ltd Sinks to 52-Week Low in Stock-Specific Sell-Off
While the broader market indices have shown resilience, Gujarat Apollo Industries Ltd has succumbed to selling pressure, hitting a fresh 52-week low of Rs 349.85 on 8 Jul 2026. This decline comes despite some recent improvements in the company’s financials, highlighting a disconnect between fundamentals and market sentiment.
Read full news article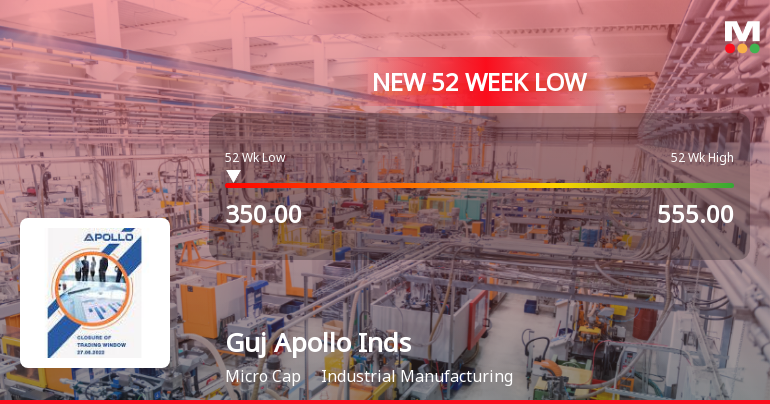
Markets Rally, But Gujarat Apollo Industries Ltd Sinks to 52-Week Low in Stock-Specific Sell-Off
While the broader market enjoys a three-week rally, Gujarat Apollo Industries Ltd has diverged sharply, hitting a fresh 52-week low of Rs 350 on 7 Jul 2026. This decline comes despite some recent improvements in the company’s financials, underscoring a complex interplay of factors weighing on the stock.
Read full news article Announcements
Reply to Clarification- Financial results
19-Sep-2019 | Source : NSE
| The Exchange had sought clarification from Gujarat Apollo Industries Limited for the quarter ended 30-Jun-2019 with respect to Regulation 33 of the SEBI (Listing Obligations and Disclosure Requirements) Regulations, 2015. On basis of above the Company was required to clarify the following: -1. Consolidated Financial Results not submitted The response of the Company is enclosed. |
Outcome of Board Meeting
06-Sep-2019 | Source : NSE
| Gujarat Apollo Industries Limited has informed the Exchange regarding Board meeting held on September 06, 2019. |
Financial Result Updates
06-Sep-2019 | Source : NSE
| Gujarat Apollo Industries Limited has submitted to the Exchange, the financial results for the period ended June 30, 2019. |
Corporate Actions

No Upcoming Board Meetings

Gujarat Apollo Industries Ltd has declared 20% dividend, ex-date: 23 Sep 25

No Splits history available

Gujarat Apollo Industries Ltd has announced 1:2 bonus issue, ex-date: 19 Dec 08

No Rights history available
Quality key factors
Valuation key factors
Technicals key factors
 Technical Indicator Scale: Bearish, Mildly Bearish, Sideways, Mildly Bullish, Bullish Turned
 Shareholding Snapshot : Jun 2026
Shareholding Compare (%holding)
Non Institution
None
Held by 0 Schemes
Held by 2 FIIs (0.0%)
Asit Anilkumar Patel Huf (17.35%)
Pankaj Prasoon And Huf (2.66%)
36.2%
Quarterly Results Snapshot (Consolidated) - Mar'26 - YoY

YoY Growth in quarter ended Mar 2026 is -24.25% vs 30.38% in Mar 2025

YoY Growth in quarter ended Mar 2026 is 120.89% vs -383.98% in Mar 2025
Half Yearly Results Snapshot (Consolidated) - Sep'25
Growth in half year ended Sep 2025 is 30.56% vs -39.59% in Sep 2024
Growth in half year ended Sep 2025 is -60.21% vs 3.66% in Sep 2024
Nine Monthly Results Snapshot (Consolidated) - Dec'25
YoY Growth in nine months ended Dec 2025 is 63.24% vs -44.20% in Dec 2024
YoY Growth in nine months ended Dec 2025 is -62.88% vs -13.82% in Dec 2024
Annual Results Snapshot (Consolidated) - Mar'26
YoY Growth in year ended Mar 2026 is 27.51% vs -27.19% in Mar 2025
YoY Growth in year ended Mar 2026 is 154.27% vs -78.84% in Mar 2025
About Gujarat Apollo Industries Ltd

Company Coordinates


