
Compare Guj. Ambuja Exp with Similar Stocks
Stock DNA
Other Agricultural Products
INR 8,125 Cr (Small Cap)
25.00
21
0.15%
-0.13
9.32%
2.37
Total Returns (Price + Dividend) 
Latest dividend: 0.25 per share ex-dividend date: Aug-22-2025
Risk Adjusted Returns v/s
Returns Beta

News
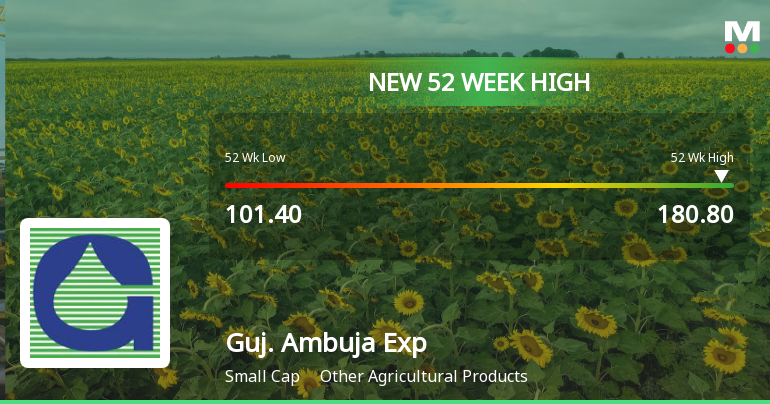
Broad-Based Technical Strength Lifts Gujarat Ambuja Exports Ltd to 52-Week High of Rs 178.75
Surging to a fresh 52-week high of Rs 178.75 on 3 Aug 2026, Gujarat Ambuja Exports Ltd has demonstrated remarkable price momentum, outperforming its sector and the broader market with a 60.81% gain over the past year.
Read full news articleAre Gujarat Ambuja Exports Ltd latest results good or bad?
Gujarat Ambuja Exports Ltd has reported notable financial results for Q1 FY27, showcasing significant operational efficiency and profitability metrics. The company achieved a net profit of ₹176.77 crores, reflecting a substantial year-on-year growth of 171.87%. Revenue for the quarter reached ₹1,594.22 crores, marking a 23.47% increase compared to the same period last year, and an 8.71% rise from the previous quarter. This indicates a strong demand for its maize products and edible oils, contributing to its record sales performance. The operating margin improved to 14.55%, the highest in seven quarters, which signifies enhanced operational efficiency. The profit after tax margin also saw a notable increase to 11.09%, up 607 basis points year-on-year, highlighting effective cost management and operational leverage. Furthermore, the company's interest costs remained low, indicating a comfortable debt positio...
Read full news article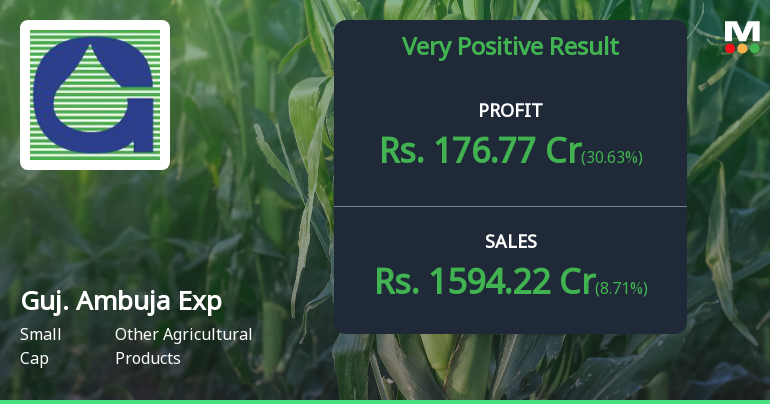
Gujarat Ambuja Exports Q1 FY27: Stellar Profit Surge Drives Stock Rally
Gujarat Ambuja Exports Ltd., India's pioneering agro-processing conglomerate, has delivered a blockbuster first quarter for FY2027, with consolidated net profit surging 171.87% year-on-year to ₹176.77 crores in Q1 FY27, up from ₹65.02 crores in the corresponding quarter last year. The company's shares have responded positively, trading at ₹172.10 as of July 31, 2026, reflecting a remarkable 57.38% gain over the past twelve months and significantly outperforming the Sensex's 3.81% decline during the same period.
Read full news article Announcements
Board Meeting Outcome for Outcome Of Board Meeting Held On 01St August 2026
01-Aug-2026 | Source : BSEOutcome of Board Meeting held on 01st August 2026
Record Date For Payment Of Final Dividend For FY 2025-26
01-Aug-2026 | Source : BSERecord Date for Payment of Final Dividend for FY 2025-26
Submission Of Unaudited Standalone And Consolidated Financial Results Of The Company For The Quarter Ended 30Th June 2026
01-Aug-2026 | Source : BSESubmission of Unaudited Standalone and Consolidated Financial Results of the Company for the quarter ended 30th June 2026
Corporate Actions

No Upcoming Board Meetings

Gujarat Ambuja Exports Ltd has declared 25% dividend, ex-date: 22 Aug 25

Gujarat Ambuja Exports Ltd has announced 1:2 stock split, ex-date: 01 Oct 20

Gujarat Ambuja Exports Ltd has announced 1:1 bonus issue, ex-date: 15 Mar 24

No Rights history available
Quality key factors
Valuation key factors
Technicals key factors
 Technical Indicator Scale: Bearish, Mildly Bearish, Sideways, Mildly Bullish, Bullish Turned
 Shareholding Snapshot : Jun 2026
Shareholding Compare (%holding)
Promoters
None
Held by 12 Schemes (0.21%)
Held by 63 FIIs (3.02%)
Manish Vijaykumar Gupta (52.4%)
Massachusetts Institute Of Technology (1.19%)
20.5%
Quarterly Results Snapshot (Consolidated) - Jun'26 - QoQ

QoQ Growth in quarter ended Jun 2026 is 8.71% vs -1.19% in Mar 2026

QoQ Growth in quarter ended Jun 2026 is 30.63% vs 105.28% in Mar 2026
Half Yearly Results Snapshot (Consolidated) - Sep'25
Growth in half year ended Sep 2025 is 25.41% vs -2.78% in Sep 2024
Growth in half year ended Sep 2025 is -29.44% vs -4.97% in Sep 2024
Nine Monthly Results Snapshot (Consolidated) - Dec'25
YoY Growth in nine months ended Dec 2025 is 27.38% vs -6.54% in Dec 2024
YoY Growth in nine months ended Dec 2025 is -22.29% vs -14.56% in Dec 2024
Annual Results Snapshot (Consolidated) - Mar'26
YoY Growth in year ended Mar 2026 is 24.20% vs -6.38% in Mar 2025
YoY Growth in year ended Mar 2026 is 22.04% vs -27.91% in Mar 2025
About Gujarat Ambuja Exports Ltd

Company Coordinates


