
Compare Gujarat Kidney with Similar Stocks
Dashboard
Strong ability to service debt as the company has a low Debt to EBITDA ratio of 1.08 times
Healthy long term growth as Net Sales has grown by an annual rate of 0% and Operating profit at 0%
With a growth in Net Sales of 2.87%, the company declared Very Positive results in Mar 26
With ROE of 6.1, it has a Very Expensive valuation with a 4 Price to Book Value
Total Returns (Price + Dividend) 
Gujarat Kidney for the last several years.
Risk Adjusted Returns v/s
Returns Beta

News

Gujarat Kidney & Super Speciality Ltd Shows Technical Momentum Shift Amid Micro-Cap Hospital Sector
Gujarat Kidney & Super Speciality Ltd, a micro-cap player in the hospital sector, has witnessed a notable shift in its technical momentum, moving from a sideways trend to a mildly bullish stance. This change is underscored by a series of technical indicator signals and price action that suggest improving investor sentiment and potential for further gains.
Read full news article
Gujarat Kidney & Super Speciality Ltd Upgraded to Hold on Improved Technicals and Financials
Gujarat Kidney & Super Speciality Ltd has seen its investment rating upgraded from Sell to Hold, reflecting a marked improvement in technical indicators and solid financial performance. The company’s Mojo Score rose to 52.0, signalling a more balanced outlook amid a micro-cap hospital sector environment. This upgrade follows a comprehensive reassessment across quality, valuation, financial trends, and technical parameters, highlighting both opportunities and challenges for investors.
Read full news article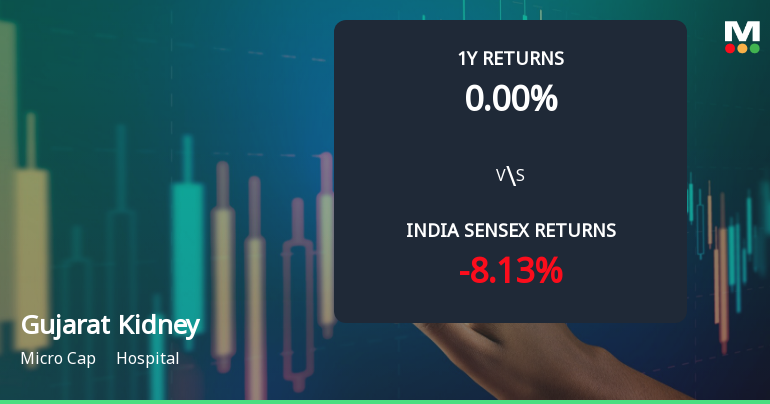
Gujarat Kidney & Super Speciality Ltd Sees Technical Momentum Shift Amid Sideways Trend
Gujarat Kidney & Super Speciality Ltd, a micro-cap player in the hospital sector, has witnessed a notable shift in its technical momentum, moving from a mildly bearish stance to a sideways trend. This change is underscored by mixed signals from key technical indicators such as MACD, RSI, Bollinger Bands, and moving averages, reflecting a nuanced outlook for investors amid recent price movements.
Read full news article Announcements
Corporate Actions

No Upcoming Board Meetings

No Dividend history available

No Splits history available

No Bonus history available

No Rights history available
Quality key factors
Valuation key factors
Technicals key factors
 Technical Indicator Scale: Bearish, Mildly Bearish, Sideways, Mildly Bullish, Bullish Turned
 Shareholding Snapshot : Mar 2026
Shareholding Compare (%holding)
Promoters
None
Held by 2 Schemes (0.0%)
Held by 12 FIIs (4.88%)
Pragnesh Yashwantsinh Bharpoda (38.16%)
Khandelwal Finance Private Limited (1.67%)
10.64%
Quarterly Results Snapshot (Standalone) - Mar'26 - QoQ

QoQ Growth in quarter ended Mar 2026 is -5.33% vs 1.24% in Dec 2025
QoQ Growth in quarter ended Mar 2026 is -41.20% vs 1.30% in Dec 2025
Half Yearly Results Snapshot (Standalone) - Sep'25
Not Applicable: The company has declared_date for only one period
Not Applicable: The company has declared_date for only one period
Nine Monthly Results Snapshot (Standalone) - Dec'25
Not Applicable: The company has declared_date for only one period
Not Applicable: The company has declared_date for only one period
Annual Results Snapshot (Standalone) - Mar'26
Not Applicable: The company has declared_date for only one period
Not Applicable: The company has declared_date for only one period
About Gujarat Kidney & Super Speciality Ltd

Company Coordinates


