
Compare Guj. Terce Labs. with Similar Stocks
Stock DNA
Pharmaceuticals & Biotechnology
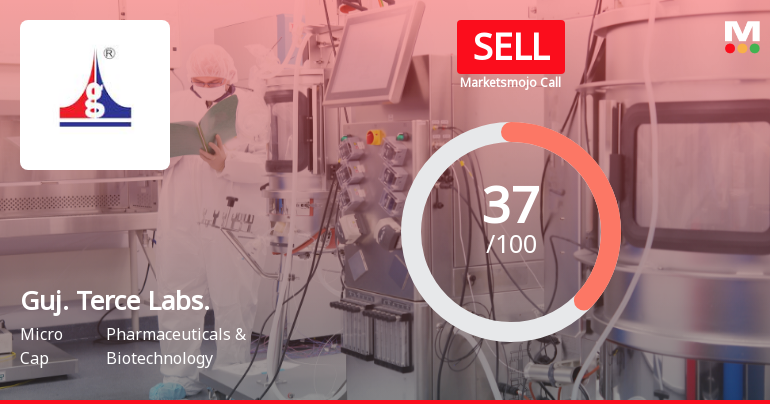
INR 27 Cr (Micro Cap)
11.00
33
0.00%
-0.30
25.13%
2.79
Total Returns (Price + Dividend) 
Guj. Terce Labs. for the last several years.
Risk Adjusted Returns v/s
Returns Beta

News
Gujarat Terce Laboratories Ltd Upgraded to Sell on Improved Financial and Valuation Metrics
Gujarat Terce Laboratories Ltd has seen its investment rating upgraded from Strong Sell to Sell as of 1 June 2026, reflecting notable improvements in its financial trend and valuation metrics, alongside a mild easing in technical bearishness. Despite persistent challenges in sales growth and market performance, the company’s enhanced profitability and attractive valuation multiples have prompted a reassessment of its outlook by analysts.
Read full news article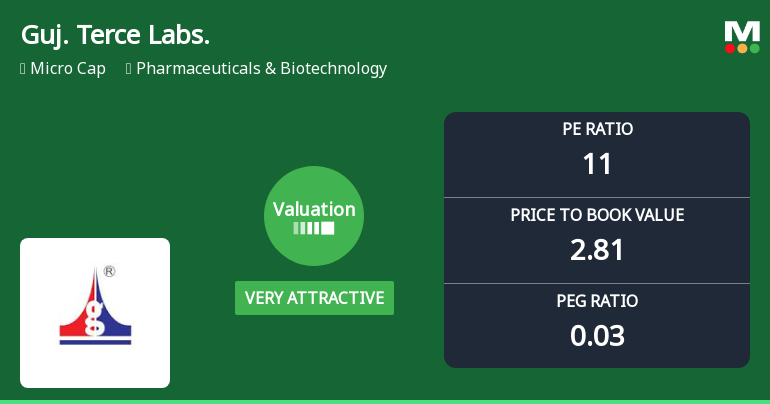
Gujarat Terce Laboratories Ltd Valuation Shifts to Very Attractive Amid Sector Challenges
Gujarat Terce Laboratories Ltd has witnessed a significant improvement in its valuation parameters, shifting from a previously very expensive rating to a very attractive one. This change comes despite the company’s recent underperformance relative to the Sensex and peers in the Pharmaceuticals & Biotechnology sector, highlighting a compelling opportunity for investors to reassess the stock’s price attractiveness based on its current financial metrics and market positioning.
Read full news article Announcements
Announcement under Regulation 30 (LODR)-Investor Presentation
03-Jun-2026 | Source : BSEDetailed disclosure is attached.
Amendment To The Code Of Practices And Procedures For Fair Disclosure Of Unpublished Price Sensitive Information
01-Jun-2026 | Source : BSEThe amended code is enclosed.
Announcement under Regulation 30 (LODR)-Newspaper Publication
30-May-2026 | Source : BSECopy of the newspaper publication for the financial results for the year ended 31 March 2026.
Corporate Actions

No Upcoming Board Meetings

No Dividend history available

No Splits history available

No Bonus history available

No Rights history available
Quality key factors
Valuation key factors
Technicals key factors
 Technical Indicator Scale: Bearish, Mildly Bearish, Sideways, Mildly Bullish, Bullish Turned
 Shareholding Snapshot : Mar 2026
Shareholding Compare (%holding)
Non Institution
None
Held by 0 Schemes
Held by 0 FIIs
Aalap Natubhai Prajapati (17.35%)
Sagar Saxena (1.35%)
54.58%
Quarterly Results Snapshot (Standalone) - Mar'26 - QoQ

QoQ Growth in quarter ended Mar 2026 is -7.24% vs -4.95% in Dec 2025
QoQ Growth in quarter ended Mar 2026 is -86.84% vs -45.71% in Dec 2025
Half Yearly Results Snapshot (Standalone) - Sep'25
Growth in half year ended Sep 2025 is -5.60% vs 10.73% in Sep 2024
Growth in half year ended Sep 2025 is -2.86% vs 244.33% in Sep 2024
Nine Monthly Results Snapshot (Standalone) - Dec'25
YoY Growth in nine months ended Dec 2025 is -4.75% vs 5.87% in Dec 2024
YoY Growth in nine months ended Dec 2025 is -12.03% vs 903.33% in Dec 2024
Annual Results Snapshot (Standalone) - Mar'26
YoY Growth in year ended Mar 2026 is -5.44% vs 4.65% in Mar 2025

YoY Growth in year ended Mar 2026 is 324.49% vs -508.33% in Mar 2025
About Gujarat Terce Laboratories Ltd

Company Coordinates


