
Compare Guj. Toolroom with Similar Stocks
Dashboard
With a Operating Losses, the company has a Weak Long Term Fundamental Strength
- Low ability to service debt as the company has a high Debt to EBITDA ratio of -12.41 times
The company has declared Negative results for the last 5 consecutive quarters
Risky - Negative EBITDA
Below par performance in long term as well as near term
Stock DNA
Plastic Products - Industrial
INR 75 Cr (Micro Cap)
4.00
37
0.00%
0.17
6.53%
0.23
Total Returns (Price + Dividend) 
Latest dividend: 0.11681599999999998 per share ex-dividend date: Apr-19-2024
Risk Adjusted Returns v/s
Returns Beta

News
Gujarat Toolroom Ltd is Rated Strong Sell
Gujarat Toolroom Ltd is rated Strong Sell by MarketsMOJO, with this rating last updated on 16 February 2026. However, the analysis and financial metrics discussed here reflect the company’s current position as of 17 June 2026, providing investors with the latest insights into its performance and outlook.
Read full news article
Gujarat Toolroom Ltd is Rated Strong Sell
Gujarat Toolroom Ltd is rated Strong Sell by MarketsMOJO, with this rating last updated on 16 February 2026. However, the analysis and financial metrics discussed here reflect the stock’s current position as of 08 June 2026, providing investors with the latest insights into the company’s performance and outlook.
Read full news article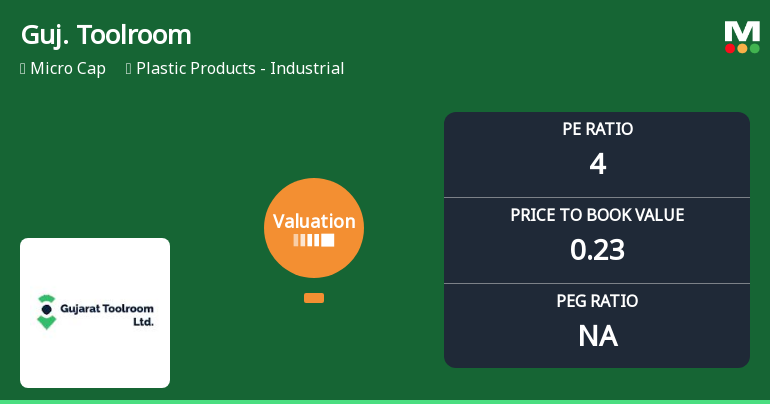
Gujarat Toolroom Ltd’s Valuation Shifts Signal Heightened Risk Amid Market Pressure
Gujarat Toolroom Ltd, a micro-cap player in the Plastic Products - Industrial sector, has witnessed a marked deterioration in its valuation parameters, shifting from very attractive to risky territory. This change, coupled with a significant downgrade in its Mojo Grade to Strong Sell, underscores growing investor concerns amid weak financial metrics and underperformance relative to peers and the broader market.
Read full news article Announcements
Closure of Trading Window
23-Jun-2026 | Source : BSEClosure of Trading Window
Announcement under Regulation 30 (LODR)-Resignation of Director
05-Jun-2026 | Source : BSEIntimation for Resignation of Ms. Rakha Rani Naraniwal from the Post of Independent Director of the Company w.e.f. 05th June 2026
Announcement under Regulation 30 (LODR)-Newspaper Publication
30-May-2026 | Source : BSENewspaper Publication for the Audited Standalone and Consolidated Financial Results for 31st March 2026
Corporate Actions

No Upcoming Board Meetings

Gujarat Toolroom Ltd has declared 100% dividend, ex-date: 19 Apr 24

Gujarat Toolroom Ltd has announced 1:10 stock split, ex-date: 06 Mar 23

Gujarat Toolroom Ltd has announced 5:1 bonus issue, ex-date: 18 Feb 25

Gujarat Toolroom Ltd has announced 11:10 rights issue, ex-date: 05 Jun 24
Quality key factors
Valuation key factors
Technicals key factors
 Technical Indicator Scale: Bearish, Mildly Bearish, Sideways, Mildly Bullish, Bullish Turned
 Shareholding Snapshot : Mar 2026
Shareholding Compare (%holding)
Non Institution
None
Held by 1 Schemes (0.07%)
Held by 0 FIIs
None
Neighbourhood Investment Private Limited (2.08%)
91.06%
Quarterly Results Snapshot (Consolidated) - Mar'26 - YoY

YoY Growth in quarter ended Mar 2026 is -100.00% vs -62.99% in Mar 2025

YoY Growth in quarter ended Mar 2026 is 238.19% vs -97.33% in Mar 2025
Half Yearly Results Snapshot (Standalone) - Sep'24
Growth in half year ended Sep 2024 is -7.35% vs 2,25,300.00% in Sep 2023
Growth in half year ended Sep 2024 is 178.93% vs 31,700.00% in Sep 2023
Nine Monthly Results Snapshot (Standalone) - Dec'24
YoY Growth in nine months ended Dec 2024 is -10.42% vs 543.53% in Dec 2023
YoY Growth in nine months ended Dec 2024 is 45.86% vs 976.92% in Dec 2023
Annual Results Snapshot (Consolidated) - Mar'26
YoY Growth in year ended Mar 2026 is -97.46% vs 60.17% in Mar 2025
YoY Growth in year ended Mar 2026 is -85.83% vs -25.62% in Mar 2025
About Gujarat Toolroom Ltd

Company Coordinates


