Guj.Nat.Resour.

INR
99.10
-0.7 (-0.7%)
BSENSE

Aug 27, 01:36 PM

BSE+NSE Vol: 37.43 k

  • Price Points
  • Score
  • Mojo Parameters
  • Total Return
  • News and Corporate Actions
  • Key factors
  • Shareholding
  • Financials
  • CompanyCV
stock-summaryPrice Point
High/Low

1Day

52 Week

Valuation
Technical
Day's Volume

CASH

37.43 k (-0.19%) Volume

Shareholding (Jun 2026)

FII

1.05%

Held by 5 FIIs

DII

0.00%

Held by 0 DIIs

Promoter

1.93%

Why is Gujarat Natural Resources Ltd falling/rising?

27-Aug-2026

As of 26-Aug, Gujarat Natural Resources Ltd's stock price is rising to 99.80 after a trend reversal, gaining 0.31 (0.31%) following four days of decline. The stock remains above key moving averages and has shown significant growth, outperforming its sector by 1.31% today.

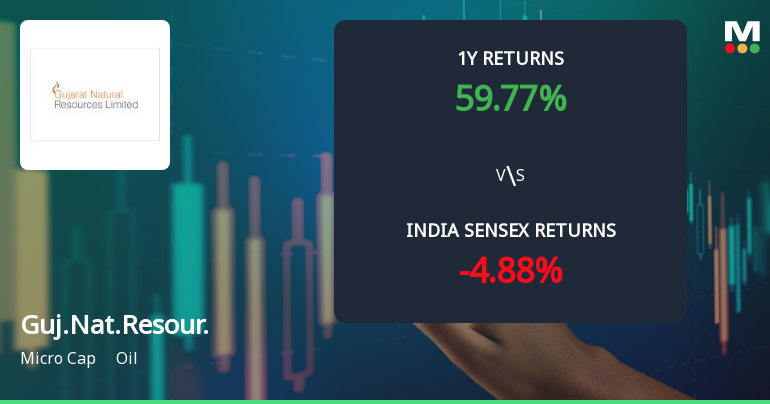
As of 26-Aug, Gujarat Natural Resources Ltd's stock price is rising, currently at 99.80, reflecting a change of 0.31 (0.31%) upward. This increase comes after a trend reversal, as the stock has gained after four consecutive days of decline. Additionally, the stock has outperformed its sector by 1.31% today, indicating a positive performance relative to its peers.<BR><BR>Despite a recent drop in investor participation, with delivery volume falling by 57.1% against the 5-day average, the stock remains above its 50-day, 100-day, and 200-day moving averages, which suggests a generally positive long-term trend. Furthermore, the stock has shown significant growth over various periods, including a remarkable 60.27% increase over the past year and an impressive 837.09% rise over the last three years. These factors contribute to the current upward movement in the stock price.

View full answer

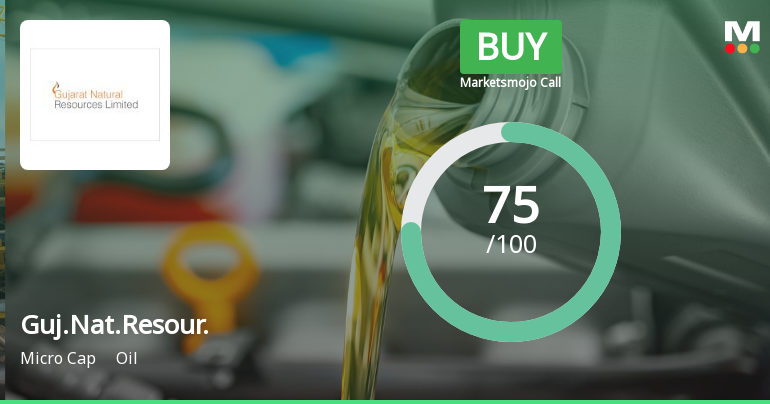
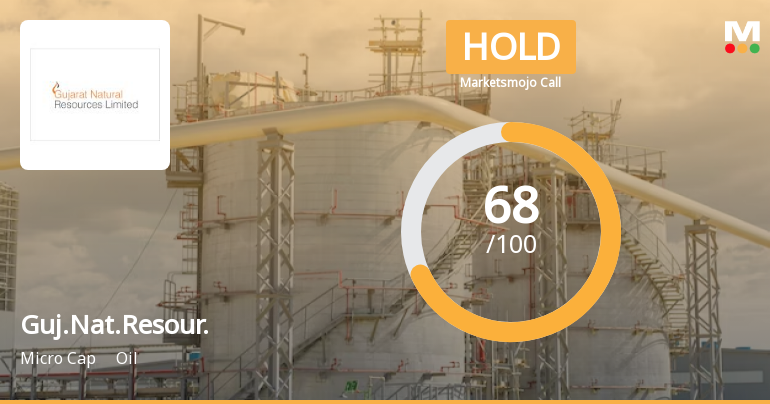
Should I buy, sell or hold Gujarat Natural Resources Ltd?

26-Aug-2026

Who are in the management team of Guj.Nat.Resour.?

14-Aug-2026

The management team of Guj.Nat.Resour. includes Shalin A Shah (Executive Director), Ashok C Shah (Chairman & Non-Executive Director), Chandrakant Chauhan, Alpesh Shantilal Swadas, and Mansi S. Shah (all Independent Non-Executive Directors), and Hitesh Donga (Non-Executive Director).

The management team of Guj.Nat.Resour. includes the following individuals:<BR><BR>1. **Shalin A Shah** - Executive Director<BR>2. **Ashok C Shah** - Chairman & Non-Executive Director<BR>3. **Chandrakant Chauhan** - Independent Non-Executive Director<BR>4. **Alpesh Shantilal Swadas** - Independent Non-Executive Director<BR>5. **Mansi S. Shah** - Independent Non-Executive Director<BR>6. **Hitesh Donga** - Non-Executive Director<BR><BR>If you need more specific information about their roles or contributions, feel free to ask!

View full answer

What does Guj.Nat.Resour. do?

14-Aug-2026

Gujarat Natural Resources Ltd operates in India's upstream oil and gas sector as a micro-cap company, reporting net sales of 11 Cr and a net profit of 1 Cr for the quarter ending March 2026. The company has a market cap of INR 1,781 Cr and a P/E ratio of 179.00.

Overview:<BR>Gujarat Natural Resources Ltd operates in the upstream oil and gas sector in India and is categorized as a micro-cap company.<BR><BR>History:<BR>The company was incorporated in 1991 and was formerly known as Lesha Energy Resources Limited. It changed its name to Gujarat Natural Resources Limited in March 2010. The latest quarterly results reported net sales and net profit for the period ending March 2026.<BR><BR>Financial Snapshot:<BR>Net Sales: 11 Cr (Quarterly Results - Mar 2026) <BR>Net Profit: 1 Cr (Quarterly Results - Mar 2026) <BR>Market Cap: INR 1,781 Cr (Micro Cap)<BR><BR>Key Metrics:<BR>P/E: 179.00 <BR>Industry P/E: 14 <BR>Dividend Yield: 0.00% <BR>Debt-Equity: 0.05 <BR>Return on Equity: 4.75% <BR>Price to Book: 8.47 <BR><BR>Contact Details:<BR>Address: 3rd Floor A Wing Gopal Palace, Opp Ocean Park Satellite Road Ahmedabad Gujarat : 380015 <BR>Email: info@gnrl.in <BR>Website: http://www.gnrl.in

View full answer

Who are the peers of the Guj.Nat.Resour.?

14-Aug-2026

Guj.Nat.Resour.'s peers include Gandhar Oil Ref., Prabha Energy, Hind.Oil Explor., Dolphin Offshore, Asian Energy, Jindal Drilling, Ganesh Benzopl., Rajasthan Securi, and Oil Country. In terms of performance, Guj.Nat.Resour. has a 1-year return of 59.32%, ranking below Gandhar Oil Ref. (61.85%) but above Prabha Energy (-39.34%).

Peers: The peers of Guj.Nat.Resour. are Gandhar Oil Ref., Prabha Energy, Hind.Oil Explor., Dolphin Offshore, Asian Energy, Jindal Drilling, Ganesh Benzopl., Rajasthan Securi, Oil Country.<BR><BR>Quality Snapshot: Excellent management risk is observed at Jindal Drilling and Ganesh Benzopl., while Average management risk is found at Gandhar Oil Ref., Hind.Oil Explor., Asian Energy, and Rajasthan Securi, and the rest. Below Average management risk is noted for Prabha Energy, Dolphin Offshore, Guj.Nat.Resour., Oil Country. Growth is Excellent at Dolphin Offshore and Rajasthan Securi, Good at Guj.Nat.Resour. and Jindal Drilling, Average at Gandhar Oil Ref., Prabha Energy, Hind.Oil Explor., Asian Energy, and the rest, and Below Average at Ganesh Benzopl. and Oil Country. Capital Structure is Excellent at Gandhar Oil Ref., Jindal Drilling, and Ganesh Benzopl., Good at Hind.Oil Explor. and Dolphin Offshore, Average at Asian Energy, Guj.Nat.Resour., and Oil Country, and Below Average at Prabha Energy.<BR><BR>Return Snapshot: The peer with the highest 1-year return is Gandhar Oil Ref. at 61.85%, while the lowest is Prabha Energy at -39.34%. Guj.Nat.Resour. has a 1-year return of 59.32%, which is significantly higher than Prabha Energy but lower than Gandhar Oil Ref. Additionally, the peers with negative six-month returns are Prabha Energy and Oil Country.

View full answer

How big is Guj.Nat.Resour.?

14-Aug-2026

As of 14th August, Gujarat Natural Resources Ltd has a market capitalization of 1,718.11 Cr, with recent net sales of 30.52 Cr and a net profit of 9.89 Cr. Shareholder's funds are 153.34 Cr, and total assets amount to 173.47 Cr.

As of 14th August, Gujarat Natural Resources Ltd has a market capitalization of 1,718.11 Cr, classified as a Micro Cap.<BR><BR>In the latest four quarters, the company reported Net Sales of 30.52 Cr and a Net Profit of 9.89 Cr.<BR><BR>The latest annual period for the balance sheet is March 2025, with Shareholder's Funds amounting to 153.34 Cr and Total Assets of 173.47 Cr.

View full answer

When is the next results date for Gujarat Natural Resources Ltd?

10-Aug-2026

The next results date for Gujarat Natural Resources Ltd is 14 August 2026.

The next results date for Gujarat Natural Resources Ltd is scheduled for 14 August 2026.

View full answer

Are Gujarat Natural Resources Ltd latest results good or bad?

02-Jun-2026

Gujarat Natural Resources Ltd's latest results show strong revenue growth of 158.66% year-on-year, reaching ₹11.20 crores, but a significant decline in net profit by 65.80% to ₹1.05 crores raises concerns about profitability and operational sustainability. Investors should be cautious due to these underlying issues despite the impressive sales figures.

Gujarat Natural Resources Ltd's latest results present a mixed picture. On one hand, the company achieved a significant increase in net sales, reporting ₹11.20 crores in Q4 FY26, which is a remarkable 158.66% growth year-on-year. This marks the highest quarterly revenue the company has ever recorded. However, this impressive topline growth is overshadowed by a sharp decline in net profit, which fell to ₹1.05 crores, down 65.80% from the previous quarter.<BR><BR>The company's profitability metrics are concerning, particularly the profit after tax (PAT) margin, which plummeted from 41.94% in Q3 FY26 to just 9.38% in Q4 FY26. Additionally, the effective tax rate of 70.42% in this quarter is unusually high and raises questions about the sustainability of the reported profits. <BR><BR>Furthermore, the reliance on non-operating income is alarming, as 78% of the profit before tax came from this source, indicating that the core operations are struggling to generate adequate returns. The overall financial performance suggests operational challenges that could impact future growth.<BR><BR>In summary, while the revenue growth is a positive sign, the significant decline in profitability and concerning operational metrics suggest that the results are not entirely good. Investors should approach with caution, considering the underlying issues despite the headline revenue figures.

View full answer

How has been the historical performance of Guj.Nat.Resour.?

17-Nov-2025

Guj.Nat.Resour. has experienced fluctuating net sales and profitability, with net sales declining to 20.05 Cr in March 2025 from 27.40 Cr in March 2024, while total liabilities and assets increased. The company reported persistent losses, with a profit before tax of -4.41 Cr in March 2025.

Answer:<BR>The historical performance of Guj.Nat.Resour. shows a fluctuating trend in net sales and profitability over the years, with a notable decline in recent periods.<BR><BR>Breakdown:<BR>Guj.Nat.Resour. reported net sales of 20.05 Cr in March 2025, down from 27.40 Cr in March 2024, but significantly up from 13.31 Cr in March 2023. The total operating income mirrored this trend, with figures of 20.05 Cr in March 2025 and 27.40 Cr in March 2024. Total expenditure, excluding depreciation, was 18.53 Cr in March 2025, a decrease from 21.85 Cr in March 2024. Operating profit (PBDIT) was 4.31 Cr in March 2025, slightly lower than 5.86 Cr in March 2024, while profit before tax remained negative at -4.41 Cr in March 2025, compared to -4.31 Cr in March 2024. The consolidated net profit also showed a marginal improvement, with a loss of -3.76 Cr in March 2025 versus -3.88 Cr in March 2024. The company's total assets increased to 173.47 Cr in March 2025 from 159.50 Cr in March 2024, while total liabilities rose to 173.47 Cr in March 2025 from 159.50 Cr in March 2024. Cash flow from operating activities was negative at -30.00 Cr in March 2025, reflecting a decline from -2.00 Cr in March 2024. Overall, the financial metrics indicate a challenging period for Guj.Nat.Resour., with fluctuating revenues and persistent losses.

View full answer

Is Guj.Nat.Resour. technically bullish or bearish?

10-Nov-2025

As of November 7, 2025, the market trend is bullish with strong daily moving averages and MACD readings, though caution is advised due to a bearish monthly RSI.

As of 7 November 2025, the technical trend has changed from mildly bullish to bullish. The current stance is bullish with a strong indication from the daily moving averages, which are bullish. The weekly and monthly MACD readings are also bullish, supporting the positive trend. However, the monthly RSI shows a bearish signal, which introduces some caution. The Bollinger Bands indicate a mildly bullish trend on both weekly and monthly time frames. Overall, while there are mixed signals, the prevailing bullish indicators suggest a strong upward momentum in the current market environment.

View full answer

Who are the top shareholders of the Guj.Nat.Resour.?

17-Jul-2025

The top shareholders of Guj.Nat.Resour. include Ravi Omprakash Agrawal with 15.8%, and promoter Payal Shalin Shah with 0.7%. Individual investors own 52.18%, while a Foreign Institutional Investor holds 0.21%, and there are no pledged promoter holdings or mutual fund investments.

The top shareholders of Guj.Nat.Resour. include a mix of individual and institutional investors. The largest public shareholder is Ravi Omprakash Agrawal, holding 15.8% of the shares. Among the promoters, Payal Shalin Shah has the highest holding at 0.7%. Additionally, individual investors collectively own 52.18% of the company. There is one Foreign Institutional Investor (FII) that holds 0.21% of the shares, and no mutual funds are currently involved with the company. Notably, there are no pledged promoter holdings.

View full answer

Is Guj.Nat.Resour. overvalued or undervalued?

09-Jun-2025

As of May 30, 2025, Guj.Nat.Resour. is considered risky and overvalued due to its negative PE ratio of -183.71 and poor financial metrics compared to industry peers, despite a recent stock performance of 379.58% that may not be sustainable.

As of 30 May 2025, the valuation grade for Guj.Nat.Resour. has moved from very expensive to risky. The company is currently assessed as overvalued given its significant negative PE ratio of -183.71, an EV to EBIT of -193.55, and an EV to EBITDA of 464.26. These ratios indicate severe financial distress and inefficiency compared to industry peers.<BR><BR>In comparison, Reliance Industries has a PE ratio of 28.05 and an EV to EBITDA of 12.68, while ONGC boasts a PE of 8.31 and an EV to EBITDA of 4.65, both of which suggest a more favorable valuation. The stark contrast in these key ratios highlights the overvaluation of Guj.Nat.Resour. Additionally, the company's stock has significantly outperformed the Sensex over the past year, returning 379.58% compared to the Sensex's 7.57%, which may not be sustainable given its current financial metrics.

View full answer

Has Guj.Nat.Resour. declared dividend?

06-Jun-2025

Gujarat Natural Resources Ltd has declared a 1% dividend, amounting to 0.1 per share, with an ex-date of September 21, 2017. Despite this, the dividend yield is 0%, as the company has not provided substantial dividend returns, although it has shown significant price appreciation over various periods.

Gujarat Natural Resources Ltd has declared a 1% dividend.<BR><BR>Dividend Details:<BR>- Percentage announced: 1%<BR>- Amount per share: 0.1<BR>- Ex-date: 21 Sep 17<BR><BR>Dividend Yield: 0%<BR><BR>Total Returns by Period:<BR>In the last 6 months, the price return was 189.16%, with a dividend return of 0%, resulting in a total return of 189.16%.<BR><BR>Over the past year, the price return was 368.68%, with a dividend return of 0%, leading to a total return of 368.68%.<BR><BR>In the 2-year period, the price return was 389.93%, with a dividend return of 0%, culminating in a total return of 389.93%.<BR><BR>For the 3-year period, the price return was 268.8%, with a dividend return of 0%, resulting in a total return of 268.8%.<BR><BR>In the last 4 years, the price return was 440.43%, with a dividend return of 0%, leading to a total return of 440.43%.<BR><BR>Over the past 5 years, the price return was 493.38%, with a dividend return of 0%, culminating in a total return of 493.38%.<BR><BR>Overall, while Gujarat Natural Resources Ltd has declared a dividend, the dividend yield remains at 0%, indicating that the company has not provided substantial dividend returns in recent periods. However, the price returns over various periods have been significantly positive, suggesting strong capital appreciation.

View full answer
iScoreScore
Part of MojoOne Strategy
Click here to find our call on this stock
Strong Sell
Sell
Hold
Buy
Strong Buy

Dashboard

1

Healthy long term growth as Net Sales has grown by an annual rate of 32.02% and Operating profit at 44.74%

 
2

With a growth in Net Profit of 488.08%, the company declared Outstanding results in Jun 26

3

Increasing Participation by Institutional Investors

4

Market Beating performance in long term as well as near term

stock-summaryMojo Parameters

Mojo Parameters

Loading Valuation Snapshot...

Stock DNA

stock-summary
Industry

Oil

stock-summary
Market cap

INR 1,548 Cr (Micro Cap)

stock-summary
P/E

79.00

stock-summary
Industry P/E

14

stock-summary
Dividend Yield

0.00%

stock-summary
Debt Equity

0.05

stock-summary
Return on Equity

4.75%

stock-summary
Price to Book

7.35

Revenue and Profits:
Net Sales:
6 Cr
(Quarterly Results - Jun 2026)
Net Profit:
11 Cr
stock-summaryTotal Returns
Total Returns (Price + Dividend) stock-summary
Dividend Yield (0%)
TimePeriod
Price Return
Dividend Return
Total Return
3 Months
3.27%
0%
3.27%
6 Months
-2.27%
0%
-2.27%
1 Year
59.15%
0%
59.15%
2 Years
641.77%
0%
641.77%
3 Years
830.52%
0%
830.52%
4 Years
687.76%
0%
687.76%
5 Years
963.3%
0%
963.3%

Latest dividend: 0.07817490494296578 per share ex-dividend date: Sep-21-2017

Risk Adjusted Returns v/s stock-summary
Returns Beta
Icon
Beta has not been calculated since enough price history is not available
stock-summaryNews & Corporate Actions

Announcements stock-summary

Announcement under Regulation 30 (LODR)-Newspaper Publication

15-Aug-2026 | Source : BSE

Copy of Newspaper Publication_30.06.2026_Unaudited Financial Results

Results-Financial Results For June 30 2026

14-Aug-2026 | Source : BSE

Financial Results-30.06.2026

Announcement under Regulation 30 (LODR)-Change in Directorate

14-Aug-2026 | Source : BSE

Appointment of Mrs. Jhanvi Vikas Sethi Additional (Independent) Director w.e.f. 14/08/2026

Corporate Actions stock-summary

stock-summary
BOARD MEETING

No Upcoming Board Meetings

stock-summary
DIVIDEND

Gujarat Natural Resources Ltd has declared 1% dividend, ex-date: 21 Sep 17

stock-summary
SPLITS

No Splits history available

stock-summary
BONUS

No Bonus history available

stock-summary
RIGHTS

Gujarat Natural Resources Ltd has announced 3:5 rights issue, ex-date: 03 Dec 24

stock-summaryKey Factors

Quality key factors stock-summary

Factor
Value
Sales Growth (5y)
32.02%
EBIT Growth (5y)
44.74%
EBIT to Interest (avg)
-4.97
Debt to EBITDA (avg)
5.02
Net Debt to Equity (avg)
0.05
Sales to Capital Employed (avg)
0.11
Tax Ratio
16.27%
Dividend Payout Ratio
0
Pledged Shares
0
Institutional Holding
1.05%
ROCE (avg)
-1.42%
ROE (avg)
0.95%

Valuation key factors

Factor
Value
P/E Ratio
79
Industry P/E
14
Price to Book Value
7.35
EV to EBIT
100.92
EV to EBITDA
69.37
EV to Capital Employed
7.03
EV to Sales
46.89
PEG Ratio
0.11
Dividend Yield
NA
ROCE (Latest)
2.07%
ROE (Latest)
4.75%

Technicals key factors

Indicator
Weekly
Monthly
MACD
Bullish
Mildly Bearish
RSI
No Signal
No Signal
Bollinger Bands
Mildly Bullish
Bullish
Moving Averages
Bullish (Daily)
KST
Bullish
Mildly Bearish
Dow Theory
Mildly Bullish
Mildly Bearish
OBV
Mildly Bullish
Mildly Bullish
stock-summary Technical Indicator Scale: Bearish, Mildly Bearish, Sideways, Mildly Bullish, Bullish  Turned 
stock-summaryShareholding
Shareholding Snapshot : Jun 2026stock-summary
Shareholding Compare (%holding) stock-summary
Majority shareholders

Non Institution

Pledged Promoter Holdings

None

Mutual Funds

Held by 0 Schemes

FIIs

Held by 5 FIIs (1.05%)

Promoter with highest holding

Payal Shalin Shah (0.7%)

Highest Public shareholder

Ravi Omprakash Agrawal (15.8%)

Individual Investors Holdings

33.51%

stock-summaryFinancial
[
  {
    "link": "quarterly",
    "btn_text": "All Quarterly Results",
    "header": "Quarterly Results Snapshot (Consolidated) - Jun'26 - YoY",
    "rhs": [
      {
        "prefix": "Net Sales ",
        "suffix": "YoY Growth in quarter ended Jun 2026 is 70.75% vs -47.74% in Jun 2025",
        "dir": 1
      },
      {
        "prefix": "Consolidated Net Profit ",
        "suffix": "YoY Growth in quarter ended Jun 2026 is 488.08% vs 141.25% in Jun 2025",
        "dir": 1
      }
    ],
    "table": {
      "header": [
        "Jun'26",
        "Jun'25",
        "Change(%)"
      ],
      "body": [
        {
          "field": "Net Sales",
          "val1": "5.72",
          "val2": "3.35",
          "chgp": "70.75%",
          "chgp_class": "positive"
        },
        {
          "field": "Operating Profit (PBDIT) excl Other Income",
          "val1": "11.56",
          "val2": "0.27",
          "chgp": "4,181.48%",
          "chgp_class": "positive"
        },
        {
          "field": "Interest",
          "val1": "0.05",
          "val2": "0.60",
          "chgp": "-91.67%",
          "chgp_class": "positive"
        },
        {
          "field": "Exceptional Items",
          "val1": "0.00",
          "val2": "0.00",
          "chgp": "",
          "chgp_class": "neutral"
        },
        {
          "field": "Consolidate Net Profit",
          "val1": "11.35",
          "val2": "1.93",
          "chgp": "488.08%",
          "chgp_class": "positive"
        },
        {
          "field": "Operating Profit Margin (Excl OI)",
          "val1": "202.10%",
          "val2": "8.06%",
          "chgp": "194.04%",
          "chgp_class": "positive"
        }
      ]
    }
  },
  {
    "link": "half-yearly",
    "btn_text": "All Half Yearly Results",
    "header": "Half Yearly Results Snapshot (Consolidated) - Sep'25",
    "rhs": [
      {
        "prefix": "Net Sales ",
        "suffix": " Growth in half year ended Sep 2025 is 5.82% vs -13.70% in Sep 2024",
        "dir": 1
      },
      {
        "prefix": "Consolidated Net Profit ",
        "suffix": " Growth in half year ended Sep 2025 is 1,273.81% vs 123.20% in Sep 2024",
        "dir": 1
      }
    ],
    "table": {
      "header": [
        "Sep'25",
        "Sep'24",
        "Change(%)"
      ],
      "body": [
        {
          "field": "Net Sales",
          "val1": "12.00",
          "val2": "11.34",
          "chgp": "5.82%",
          "chgp_class": "positive"
        },
        {
          "field": "Operating Profit (PBDIT) excl Other Income",
          "val1": "5.12",
          "val2": "4.25",
          "chgp": "20.47%",
          "chgp_class": "positive"
        },
        {
          "field": "Interest",
          "val1": "1.18",
          "val2": "0.72",
          "chgp": "63.89%",
          "chgp_class": "negative"
        },
        {
          "field": "Exceptional Items",
          "val1": "0.00",
          "val2": "0.00",
          "chgp": "",
          "chgp_class": "neutral"
        },
        {
          "field": "Consolidate Net Profit",
          "val1": "5.77",
          "val2": "0.42",
          "chgp": "1,273.81%",
          "chgp_class": "positive"
        },
        {
          "field": "Operating Profit Margin (Excl OI)",
          "val1": "42.67%",
          "val2": "37.48%",
          "chgp": "5.19%",
          "chgp_class": "positive"
        }
      ]
    }
  },
  {
    "link": "nine-monthly",
    "btn_text": "All Nine Monthly Results",
    "header": "Nine Monthly Results Snapshot (Consolidated) - Dec'25",
    "rhs": [
      {
        "prefix": "Net Sales ",
        "suffix": "YoY Growth in nine months ended Dec 2025 is 22.90% vs -19.63% in Dec 2024",
        "dir": 1
      },
      {
        "prefix": "Consolidated Net Profit ",
        "suffix": "YoY Growth in nine months ended Dec 2025 is 507.37% vs -95.50% in Dec 2024",
        "dir": 1
      }
    ],
    "table": {
      "header": [
        "Dec'25",
        "Dec'24",
        "Change(%)"
      ],
      "body": [
        {
          "field": "Net Sales",
          "val1": "19.32",
          "val2": "15.72",
          "chgp": "22.90%",
          "chgp_class": "positive"
        },
        {
          "field": "Operating Profit (PBDIT) excl Other Income",
          "val1": "8.67",
          "val2": "4.38",
          "chgp": "97.95%",
          "chgp_class": "positive"
        },
        {
          "field": "Interest",
          "val1": "1.79",
          "val2": "1.96",
          "chgp": "-8.67%",
          "chgp_class": "positive"
        },
        {
          "field": "Exceptional Items",
          "val1": "0.00",
          "val2": "0.00",
          "chgp": "",
          "chgp_class": "neutral"
        },
        {
          "field": "Consolidate Net Profit",
          "val1": "8.84",
          "val2": "-2.17",
          "chgp": "507.37%",
          "chgp_class": "positive"
        },
        {
          "field": "Operating Profit Margin (Excl OI)",
          "val1": "44.88%",
          "val2": "27.86%",
          "chgp": "17.02%",
          "chgp_class": "positive"
        }
      ]
    }
  },
  {
    "link": "annual",
    "btn_text": "All Annual Results",
    "header": "Annual Results Snapshot (Consolidated) - Mar'26",
    "rhs": [
      {
        "prefix": "Net Sales ",
        "suffix": "YoY Growth in year ended Mar 2026 is 52.27% vs -26.82% in Mar 2025",
        "dir": 1
      },
      {
        "prefix": "Consolidated Net Profit ",
        "suffix": "YoY Growth in year ended Mar 2026 is 363.03% vs 3.09% in Mar 2025",
        "dir": 1
      }
    ],
    "table": {
      "header": [
        "Mar'26",
        "Mar'25",
        "Change(%)"
      ],
      "body": [
        {
          "field": "Net Sales",
          "val1": "30.53",
          "val2": "20.05",
          "chgp": "52.27%",
          "chgp_class": "positive"
        },
        {
          "field": "Operating Profit (PBDIT) excl Other Income",
          "val1": "10.94",
          "val2": "1.52",
          "chgp": "619.74%",
          "chgp_class": "positive"
        },
        {
          "field": "Interest",
          "val1": "0.54",
          "val2": "3.52",
          "chgp": "-84.66%",
          "chgp_class": "positive"
        },
        {
          "field": "Exceptional Items",
          "val1": "0.00",
          "val2": "0.00",
          "chgp": "",
          "chgp_class": "neutral"
        },
        {
          "field": "Consolidate Net Profit",
          "val1": "9.89",
          "val2": "-3.76",
          "chgp": "363.03%",
          "chgp_class": "positive"
        },
        {
          "field": "Operating Profit Margin (Excl OI)",
          "val1": "35.83%",
          "val2": "7.58%",
          "chgp": "28.25%",
          "chgp_class": "positive"
        }
      ]
    }
  }
]

Quarterly Results Snapshot (Consolidated) - Jun'26 - YoYstock-summary

Jun'26
Jun'25
Change(%)
Net Sales
5.72
3.35
70.75%
Operating Profit (PBDIT) excl Other Income
11.56
0.27
4,181.48%
Interest
0.05
0.60
-91.67%
Exceptional Items
0.00
0.00
Consolidate Net Profit
11.35
1.93
488.08%
Operating Profit Margin (Excl OI)
202.10%
8.06%
194.04%
Values in Rs Cr.
Direction Arrows
Net Sales

YoY Growth in quarter ended Jun 2026 is 70.75% vs -47.74% in Jun 2025

Direction Arrows
Consolidated Net Profit

YoY Growth in quarter ended Jun 2026 is 488.08% vs 141.25% in Jun 2025

Half Yearly Results Snapshot (Consolidated) - Sep'25stock-summary

Sep'25
Sep'24
Change(%)
Net Sales
12.00
11.34
5.82%
Operating Profit (PBDIT) excl Other Income
5.12
4.25
20.47%
Interest
1.18
0.72
63.89%
Exceptional Items
0.00
0.00
Consolidate Net Profit
5.77
0.42
1,273.81%
Operating Profit Margin (Excl OI)
42.67%
37.48%
5.19%
Values in Rs Cr.
Direction Arrows
Net Sales

Growth in half year ended Sep 2025 is 5.82% vs -13.70% in Sep 2024

Direction Arrows
Consolidated Net Profit

Growth in half year ended Sep 2025 is 1,273.81% vs 123.20% in Sep 2024

Nine Monthly Results Snapshot (Consolidated) - Dec'25stock-summary

Dec'25
Dec'24
Change(%)
Net Sales
19.32
15.72
22.90%
Operating Profit (PBDIT) excl Other Income
8.67
4.38
97.95%
Interest
1.79
1.96
-8.67%
Exceptional Items
0.00
0.00
Consolidate Net Profit
8.84
-2.17
507.37%
Operating Profit Margin (Excl OI)
44.88%
27.86%
17.02%
Values in Rs Cr.
Direction Arrows
Net Sales

YoY Growth in nine months ended Dec 2025 is 22.90% vs -19.63% in Dec 2024

Direction Arrows
Consolidated Net Profit

YoY Growth in nine months ended Dec 2025 is 507.37% vs -95.50% in Dec 2024

Annual Results Snapshot (Consolidated) - Mar'26stock-summary

Mar'26
Mar'25
Change(%)
Net Sales
30.53
20.05
52.27%
Operating Profit (PBDIT) excl Other Income
10.94
1.52
619.74%
Interest
0.54
3.52
-84.66%
Exceptional Items
0.00
0.00
Consolidate Net Profit
9.89
-3.76
363.03%
Operating Profit Margin (Excl OI)
35.83%
7.58%
28.25%
Values in Rs Cr.
Direction Arrows
Net Sales

YoY Growth in year ended Mar 2026 is 52.27% vs -26.82% in Mar 2025

Direction Arrows
Consolidated Net Profit

YoY Growth in year ended Mar 2026 is 363.03% vs 3.09% in Mar 2025

stock-summaryCompany CV
About Gujarat Natural Resources Ltd stock-summary
stock-summary
Gujarat Natural Resources Ltd
Micro Cap
Oil
Gujarat Natural Resources Limited, incorporated in year 1991 was formerly known as Lesha Energy Resources Limited. The Company's name was changed to Gujarat Natural Resources Limited in March, 2010 at Ahmedabad. The Company has primary focus in upstream oil & gas sector in India. It is presently engaged in the business of Oil & Gas exploration and production, and currently the Company is carrying on these activities through its 100% step down subsidiaries.
Company Coordinates stock-summary
Company Details
3rd Floor A Wing Gopal Palace, Opp Ocean Park Satellite Road Ahmedabad Gujarat : 380015
stock-summary
Tel:
stock-summary
info@gnrl.in
Registrar Details