
Compare Gulf Oil Lubric. with Similar Stocks
Total Returns (Price + Dividend) 
Latest dividend: 21.051477470250035 per share ex-dividend date: Feb-13-2026
Risk Adjusted Returns v/s
Returns Beta

News
Gulf Oil Lubricants India Ltd is Rated Sell
Gulf Oil Lubricants India Ltd is rated 'Sell' by MarketsMOJO, with this rating last updated on 12 May 2026. However, the analysis and financial metrics presented here reflect the stock's current position as of 15 June 2026, providing investors with an up-to-date view of the company’s performance and outlook.
Read full news article
Gulf Oil Lubricants India Ltd is Rated Sell
Gulf Oil Lubricants India Ltd is rated Sell by MarketsMOJO, with this rating last updated on 12 May 2026. However, the analysis and financial metrics discussed here reflect the company’s current position as of 04 June 2026, providing investors with the latest insights into the stock’s fundamentals, valuation, financial trends, and technical outlook.
Read full news article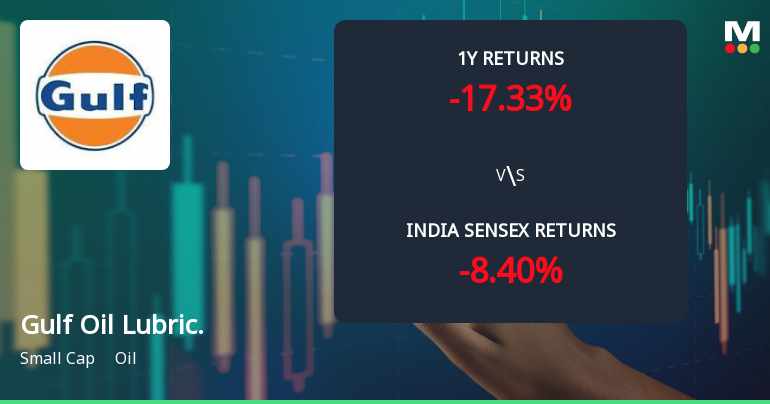
Gulf Oil Lubricants India Ltd Sees Mixed Technical Signals Amid Price Momentum Shift
Gulf Oil Lubricants India Ltd has experienced a notable shift in its technical parameters, reflecting a complex interplay of bullish and bearish signals. Despite a recent 4.35% rise in the stock price to ₹970.50, the company’s overall technical outlook remains cautiously bearish, with key indicators such as MACD and moving averages showing mixed momentum. This analysis delves into the latest technical trends, price momentum, and comparative performance against the Sensex to provide investors with a comprehensive view of the stock’s current standing.
Read full news article Announcements
Announcement under Regulation 30 (LODR)-Press Release / Media Release
15-Jun-2026 | Source : BSEA Press Release is enclosed which is self-explanatory.
Announcement under Regulation 30 (LODR)-Analyst / Investor Meet - Intimation
11-Jun-2026 | Source : BSEWe hereby inform you that a Meet is scheduled to be held with Analyst/ Institutional Investors on Tuesday June 16 2026.
Announcement under Regulation 30 (LODR)-Investor Presentation
08-Jun-2026 | Source : BSEWe enclose herewith the Investor Presentation on the Audited Financial Results (Standalone and Consolidated) for the quarter and financial year ended March 31 2026.
Corporate Actions

No Upcoming Board Meetings

Gulf Oil Lubricants India Ltd has declared 1050% dividend, ex-date: 13 Feb 26

No Splits history available

No Bonus history available

No Rights history available
Quality key factors
Valuation key factors
Technicals key factors
 Technical Indicator Scale: Bearish, Mildly Bearish, Sideways, Mildly Bullish, Bullish Turned
 Shareholding Snapshot : Mar 2026
Shareholding Compare (%holding)
Promoters
None
Held by 8 Schemes (6.3%)
Held by 159 FIIs (8.91%)
Gulf Oil International (mauritius) Inc. (67.01%)
Icici Prudential Energy Opportunities Fund (2.87%)
12.22%
Quarterly Results Snapshot (Consolidated) - Mar'26 - YoY

YoY Growth in quarter ended Mar 2026 is 10.76% vs 9.56% in Mar 2025

YoY Growth in quarter ended Mar 2026 is -2.65% vs 6.90% in Mar 2025
Half Yearly Results Snapshot (Consolidated) - Sep'25
Growth in half year ended Sep 2025 is 12.81% vs 8.92% in Sep 2024
Growth in half year ended Sep 2025 is 6.89% vs 19.85% in Sep 2024
Nine Monthly Results Snapshot (Consolidated) - Dec'25
YoY Growth in nine months ended Dec 2025 is 12.04% vs 10.15% in Dec 2024
YoY Growth in nine months ended Dec 2025 is -3.65% vs 20.71% in Dec 2024
Annual Results Snapshot (Consolidated) - Mar'26
YoY Growth in year ended Mar 2026 is 11.70% vs 10.00% in Mar 2025
YoY Growth in year ended Mar 2026 is -3.40% vs 16.85% in Mar 2025
About Gulf Oil Lubricants India Ltd

Company Coordinates


