
Compare GVK Power Infra. with Similar Stocks
Dashboard
With a Negative Book Value, the company has a Weak Long Term Fundamental Strength
- Poor long term growth as Net Sales has grown by an annual rate of -32.41% and Operating profit at 0% over the last 5 years
- The company has a negative book value of Rs 1,456.88 crore
Negative results in Mar 26
Risky - Negative EBITDA
Underperformed the market in the last 1 year
Total Returns (Price + Dividend) 
GVK Power Infra. for the last several years.
Risk Adjusted Returns v/s
Returns Beta

News
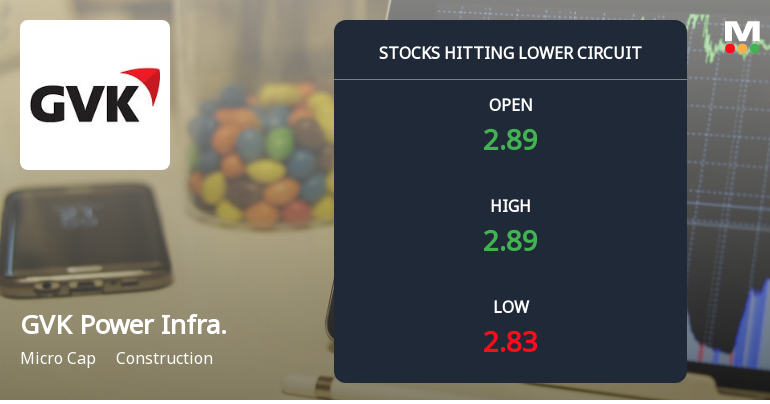
GVK Power & Infrastructure Ltd Locks at Lower Circuit With 1.03% Loss — Sellers Queue, No Buyers in Sight
At Rs 2.85, sellers were still queuing — but there were no buyers willing to take the other side. GVK Power & Infrastructure Ltd locked at its lower circuit of 1.03% on 11 Jun 2026, with unfilled sell orders and a frozen price.
Read full news article
Below All Moving Averages and Now at Lower Circuit: GVK Power & Infrastructure Ltd Loses 1.7% in a Single Session
At Rs 2.88, sellers queued relentlessly while buyers remained absent, causing GVK Power & Infrastructure Ltd to lock at its lower circuit with a 1.71% loss on 10 Jun 2026. The unfilled supply at the floor price highlights the persistent selling pressure and a frozen trading session.
Read full news article
GVK Power & Infrastructure Ltd Locks at Lower Circuit With 1.02% Loss — Sellers Queue, No Buyers in Sight
At Rs 2.92, sellers were still queuing — but there were no buyers willing to take the other side. GVK Power & Infrastructure Ltd locked at its lower circuit of 1.02% on 9 Jun 2026, with unfilled sell orders and a frozen price, signalling persistent selling pressure in a micro-cap stock with limited liquidity.
Read full news article Announcements
Newspaper Publication
30-May-2026 | Source : BSECopy of newspaper publication
Audited Financial Results For The Quarter And Year Ended 31St March 2026
29-May-2026 | Source : BSEAudited Financial results for the quarter and year ended 31st March 2026
Compliances-Reg.24(A)-Annual Secretarial Compliance
28-May-2026 | Source : BSEAnnual Secretarial Compliance Report for the Financial year 2025-26
Corporate Actions

No Upcoming Board Meetings

GVK Power & Infrastructure Ltd has declared 25% dividend, ex-date: 06 Nov 06

GVK Power & Infrastructure Ltd has announced 1:10 stock split, ex-date: 08 Feb 08

No Bonus history available

No Rights history available
Quality key factors
Valuation key factors
Technicals key factors
 Technical Indicator Scale: Bearish, Mildly Bearish, Sideways, Mildly Bullish, Bullish Turned
 Shareholding Snapshot : Mar 2026
Shareholding Compare (%holding)
Promoters
None
Held by 0 Schemes
Held by 1 FIIs (0.0%)
Vertex Projects Llp (46.41%)
None
40.45%
Quarterly Results Snapshot (Consolidated) - Mar'26 - QoQ
QoQ Growth in quarter ended Mar 2026 is 0.00% vs 0.00% in Dec 2025

QoQ Growth in quarter ended Mar 2026 is -175.23% vs 9.92% in Dec 2025
Half Yearly Results Snapshot (Consolidated) - Sep'25
Growth in half year ended Sep 2025 is -86.90% vs -29.88% in Sep 2024
Growth in half year ended Sep 2025 is -217.52% vs 293.69% in Sep 2024
Nine Monthly Results Snapshot (Consolidated) - Dec'25
YoY Growth in nine months ended Dec 2025 is -89.38% vs -25.05% in Dec 2024
YoY Growth in nine months ended Dec 2025 is -220.06% vs 474.51% in Dec 2024
Annual Results Snapshot (Consolidated) - Mar'26
YoY Growth in year ended Mar 2026 is -89.96% vs -25.74% in Mar 2025
YoY Growth in year ended Mar 2026 is -248.55% vs 2,670.34% in Mar 2025
About GVK Power & Infrastructure Ltd

Company Coordinates


