
Compare H P Cotton Tex with Similar Stocks
Stock DNA
Garments & Apparels
INR 39 Cr (Micro Cap)
13.00
26
0.00%
1.95
15.39%
2.01
Total Returns (Price + Dividend) 
Latest dividend: 0.9902723735408561 per share ex-dividend date: Sep-20-2022
Risk Adjusted Returns v/s
Returns Beta

News
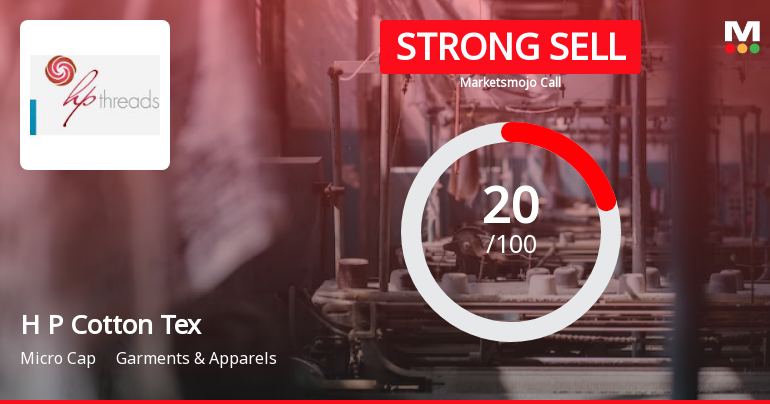
H P Cotton Textile Mills Ltd is Rated Strong Sell
H P Cotton Textile Mills Ltd is rated Strong Sell by MarketsMOJO, with this rating last updated on 22 June 2026. However, the analysis and financial metrics presented here reflect the stock’s current position as of 08 July 2026, providing investors with the latest insights into the company’s performance and outlook.
Read full news article
H P Cotton Textile Mills Ltd Downgraded to Strong Sell Amid Weak Financials and Technical Setbacks
H P Cotton Textile Mills Ltd has been downgraded from a Sell to a Strong Sell rating as of 22 June 2026, reflecting deteriorating technical indicators and disappointing quarterly financial results. Despite some attractive valuation metrics, the company’s high debt burden and weakening technical trends have raised concerns among analysts, prompting a reassessment of its investment appeal within the Garments & Apparels sector.
Read full news article
H P Cotton Textile Mills Ltd Upgraded to Sell on Technical Improvements Despite Financial Challenges
H P Cotton Textile Mills Ltd has seen its investment rating upgraded from Strong Sell to Sell as of 15 June 2026, driven primarily by a shift in technical indicators despite ongoing financial headwinds. The micro-cap garment and apparel company’s Mojo Score rose to 36.0, reflecting a nuanced balance between valuation attractiveness and operational weaknesses.
Read full news article Announcements
Compliances-Certificate under Reg. 74 (5) of SEBI (DP) Regulations 2018
07-Jul-2026 | Source : BSEPlease find attached herewith certificate under Regulation 74(5) of SEBI (DP) Regulations 2018 for the quarter ended June 30 2026.
Announcement under Regulation 30 (LODR)-Newspaper Publication
04-Jul-2026 | Source : BSEPlease find enclosed newspaper advertisement published on July 04 2026.
Closure of Trading Window
29-Jun-2026 | Source : BSEIntimation of Closure of Trading Window.
Corporate Actions

No Upcoming Board Meetings

H P Cotton Textile Mills Ltd has declared 10% dividend, ex-date: 20 Sep 22

No Splits history available

No Bonus history available

No Rights history available
Quality key factors
Valuation key factors
Technicals key factors
 Technical Indicator Scale: Bearish, Mildly Bearish, Sideways, Mildly Bullish, Bullish Turned
 Shareholding Snapshot : Jun 2026
Shareholding Compare (%holding)
Promoters
None
Held by 0 Schemes
Held by 0 FIIs
Kailash Kumar Agarwal (35.35%)
Vinod Kumar Ohri (5.1%)
28.3%
Quarterly Results Snapshot (Consolidated) - Mar'26 - QoQ

QoQ Growth in quarter ended Mar 2026 is -17.93% vs -2.53% in Dec 2025

QoQ Growth in quarter ended Mar 2026 is 4.62% vs -17.72% in Dec 2025
Half Yearly Results Snapshot (Consolidated) - Sep'25
Growth in half year ended Sep 2025 is 19.15% vs 21.05% in Sep 2024
Growth in half year ended Sep 2025 is 26.15% vs -70.52% in Sep 2024
Nine Monthly Results Snapshot (Consolidated) - Dec'25
YoY Growth in nine months ended Dec 2025 is 13.35% vs 23.12% in Dec 2024
YoY Growth in nine months ended Dec 2025 is 44.03% vs -49.68% in Dec 2024
Annual Results Snapshot (Consolidated) - Mar'26
YoY Growth in year ended Mar 2026 is 2.63% vs 36.95% in Mar 2025
YoY Growth in year ended Mar 2026 is 15.56% vs 185.56% in Mar 2025
About H P Cotton Textile Mills Ltd

Company Coordinates


