
Compare Halder Venture with Similar Stocks
Dashboard
High Debt company with Weak Long Term Fundamental Strength
- Poor long term growth as Operating profit has grown by an annual rate -4.31% of over the last 5 years
- High Debt Company with a Debt to Equity ratio (avg) of 2.59 times
- The company has been able to generate a Return on Capital Employed (avg) of 9.85% signifying low profitability per unit of total capital (equity and debt)
Stock DNA
Other Agricultural Products
INR 286 Cr (Micro Cap)
10.00
23
0.43%
1.90
16.10%
1.62
Total Returns (Price + Dividend) 
Latest dividend: 1 per share ex-dividend date: Sep-12-2025
Risk Adjusted Returns v/s
Returns Beta

News
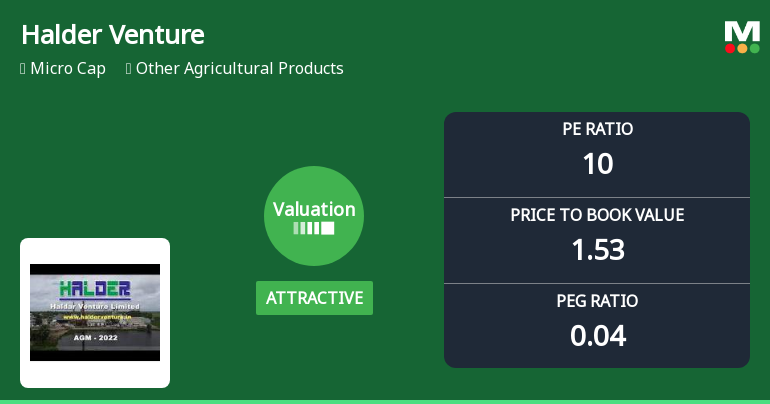
Halder Venture Ltd Valuation Turns Attractive Amid Market Volatility
Halder Venture Ltd, a micro-cap player in the Other Agricultural Products sector, has seen a notable shift in its valuation parameters, moving from fair to attractive territory. Despite a recent 4.28% decline in its share price, the company’s price-to-earnings (P/E) and price-to-book value (P/BV) ratios now present a compelling case for value-oriented investors, especially when contrasted with its peers and historical benchmarks.
Read full news article
Halder Venture Ltd is Rated Sell
Halder Venture Ltd is rated 'Sell' by MarketsMOJO, with this rating last updated on 17 June 2026. However, the analysis and financial metrics presented here reflect the stock's current position as of 10 July 2026, providing investors with an up-to-date view of the company's fundamentals, valuation, financial trends, and technical outlook.
Read full news article
Halder Venture Ltd Valuation Shifts Signal Renewed Price Attractiveness Amid Mixed Market Returns
Halder Venture Ltd, a micro-cap player in the Other Agricultural Products sector, has seen its valuation parameters shift favourably despite recent share price declines and a Sell rating from MarketsMOJO. The stock’s price-to-earnings (P/E) and price-to-book value (P/BV) ratios now indicate an attractive entry point relative to its historical averages and peer group, offering investors a nuanced perspective amid volatile market conditions.
Read full news article Announcements
Announcement under Regulation 30 (LODR)-Credit Rating
17-Jul-2026 | Source : BSECrisil Ratings Limited has reaffirmed/assigned the credit rating for the instruments/facilities of the Company. Kindly take the same in your records.
Announcement under Regulation 30 (LODR)-Issue of Securities
10-Jul-2026 | Source : BSEIntimation of receipt of In-principle Approval received for issue of 793650 warrants convertible into 793650 Equity shares of Rs. 10/- each at a price not less than Rs. 315/- each to non-promoter on preferential basis.
Announcement Under Regulation 30 Of SEBI (LODR) Reg 2015
10-Jul-2026 | Source : BSEIntimation of receipt of In-principle Approval received for issue of 793650 warrants convertible into 793650 Equity shares of Rs. 10/- each at price not less than Rs. 315/- each to non-promoter on preferential basis.
Corporate Actions

No Upcoming Board Meetings

Halder Venture Ltd has declared 10% dividend, ex-date: 12 Sep 25

No Splits history available

Halder Venture Ltd has announced 2:1 bonus issue, ex-date: 02 Sep 25

No Rights history available
Quality key factors
Valuation key factors
Technicals key factors
 Technical Indicator Scale: Bearish, Mildly Bearish, Sideways, Mildly Bullish, Bullish Turned
 Shareholding Snapshot : Mar 2026
Shareholding Compare (%holding)
Promoters
None
Held by 0 Schemes
Held by 0 FIIs
Keshab Kumar Halder (39.53%)
Baladeb Chatterjee (3.62%)
23.73%
Quarterly Results Snapshot (Consolidated) - Mar'26 - QoQ

QoQ Growth in quarter ended Mar 2026 is 106.46% vs 48.50% in Dec 2025

QoQ Growth in quarter ended Mar 2026 is -21.56% vs 289.18% in Dec 2025
Half Yearly Results Snapshot (Consolidated) - Sep'25
Growth in half year ended Sep 2025 is -41.06% vs 32.54% in Sep 2024
Growth in half year ended Sep 2025 is -198.06% vs 329.17% in Sep 2024
Nine Monthly Results Snapshot (Consolidated) - Dec'25
YoY Growth in nine months ended Dec 2025 is -50.35% vs 78.34% in Dec 2024
YoY Growth in nine months ended Dec 2025 is -57.45% vs 1,47,700.00% in Dec 2024
Annual Results Snapshot (Consolidated) - Mar'26
YoY Growth in year ended Mar 2026 is -23.48% vs 31.20% in Mar 2025
YoY Growth in year ended Mar 2026 is 36.47% vs 80.46% in Mar 2025
About Halder Venture Ltd

Company Coordinates


