
Compare Hardcast.& Waud with Similar Stocks
Dashboard
Weak Long Term Fundamental Strength with an average Return on Equity (ROE) of 4.83%
With a growth in Net Profit of 45.39%, the company declared Very Positive results in Mar 26
With ROE of 9.7, it has a Fair valuation with a 1.2 Price to Book Value
Majority shareholders : Promoters
Market Beating performance in long term as well as near term
Stock DNA
Specialty Chemicals
INR 57 Cr (Micro Cap)
12.00
53
0.00%
-0.03
9.72%
1.19
Total Returns (Price + Dividend) 
Hardcast.& Waud for the last several years.
Risk Adjusted Returns v/s
Returns Beta

News

Hardcastle & Waud Mfg Co Ltd is Rated Hold
Hardcastle & Waud Mfg Co Ltd is rated 'Hold' by MarketsMOJO. This rating was last updated on 25 May 2026, reflecting a shift from a previous 'Sell' grade. However, the analysis and financial metrics presented here are based on the company's current position as of 18 June 2026, providing investors with the latest insights into its performance and outlook.
Read full news article
Hardcastle & Waud Mfg Co Ltd Valuation Shifts Signal Renewed Price Attractiveness
Hardcastle & Waud Mfg Co Ltd has seen a significant shift in its valuation parameters, moving from a fair to a very attractive rating, driven by a combination of improved price-to-earnings and price-to-book ratios relative to its historical averages and peer group. Despite a recent dip in share price, the micro-cap specialty chemicals company’s fundamentals suggest a compelling investment case amid a challenging sector backdrop.
Read full news article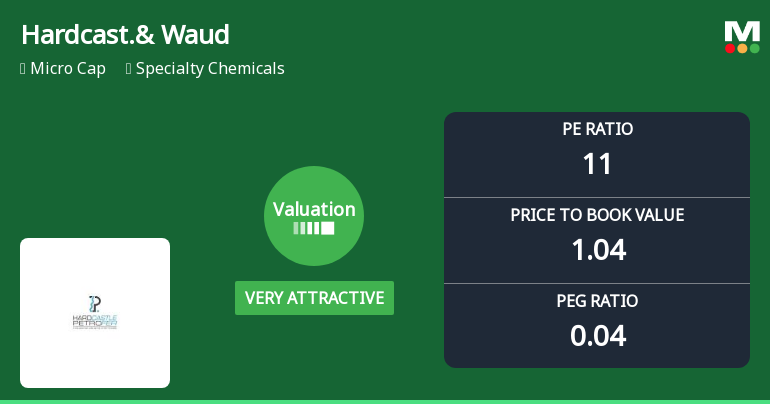
Hardcastle & Waud Mfg Co Ltd Valuation Shifts to Very Attractive Amid Specialty Chemicals Sector Dynamics
Hardcastle & Waud Mfg Co Ltd has witnessed a significant shift in its valuation parameters, moving from a fair to a very attractive rating. This change is underscored by its current price-to-earnings (P/E) ratio of 10.72 and price-to-book value (P/BV) of 1.04, positioning the micro-cap specialty chemicals company favourably against its peers and historical averages. Despite a modest day decline of 0.30%, the stock’s longer-term performance and valuation metrics suggest renewed investor interest and potential upside.
Read full news article Announcements
Announcement under Regulation 30 (LODR)-Change in Directorate
30-May-2026 | Source : BSEIntimation under Regulation 30 of Securities and Exchange Board of India (Listing Obligations and Disclosure Requirements) Regulations 2015- Retirement of Independent Director Mr Sunil Kantilal Trivedi (DIN: 00387797)
Announcement under Regulation 30 (LODR)-Retirement
30-May-2026 | Source : BSEIntimation under Regulation 30 of Securities and Exchange Board of India (Listing Obligations and Disclosure Requirements) Regulations 2015- Retirement of Independent Director Mr Sunil Kantilal Trivedi (DIN: 00387797)
Compliances-Reg.24(A)-Annual Secretarial Compliance
22-May-2026 | Source : BSEAnnual Secretarial Compliance Report for the year ended 31st March 2026.
Corporate Actions

No Upcoming Board Meetings

No Dividend history available

No Splits history available

No Bonus history available

No Rights history available
Quality key factors
Valuation key factors
Technicals key factors
 Technical Indicator Scale: Bearish, Mildly Bearish, Sideways, Mildly Bullish, Bullish Turned
 Shareholding Snapshot : Mar 2026
Shareholding Compare (%holding)
Promoters
None
Held by 2 Schemes (0.08%)
Held by 0 FIIs
Jeevdani Business Ventures Limited (49.98%)
Rashi Fincorp Ltd. (8.12%)
14.83%
Quarterly Results Snapshot (Standalone) - Mar'26 - QoQ

QoQ Growth in quarter ended Mar 2026 is 14.68% vs 23.11% in Dec 2025
QoQ Growth in quarter ended Mar 2026 is 45.39% vs 101.43% in Dec 2025
Half Yearly Results Snapshot (Standalone) - Sep'25

Growth in half year ended Sep 2025 is 58.61% vs 8.76% in Sep 2024
Growth in half year ended Sep 2025 is 150.85% vs -53.17% in Sep 2024
Nine Monthly Results Snapshot (Standalone) - Dec'25
YoY Growth in nine months ended Dec 2025 is 76.21% vs 0.00% in Dec 2024
YoY Growth in nine months ended Dec 2025 is 140.83% vs -40.89% in Dec 2024
Annual Results Snapshot (Standalone) - Mar'26
YoY Growth in year ended Mar 2026 is 80.14% vs 8.87% in Mar 2025
YoY Growth in year ended Mar 2026 is 282.17% vs -50.00% in Mar 2025
About Hardcastle & Waud Mfg Co Ltd

Company Coordinates


