
Compare Hardwyn India with Similar Stocks
Dashboard
Company has a Debt to Equity ratio (avg) of 0.02 times
Poor long term growth as Net Sales has grown by an annual rate of 6.70% and Operating profit at 13.43% over the last 5 years
Flat results in Mar 26
With ROE of 3.2, it has a Very Expensive valuation with a 2.9 Price to Book Value
Despite the size of the company, domestic mutual funds hold only 0% of the company
Market Beating Performance
Stock DNA
Furniture, Home Furnishing
INR 1,169 Cr (Micro Cap)
89.00
7
0.00%
0.01
3.25%
2.88
Total Returns (Price + Dividend) 
Hardwyn India for the last several years.
Risk Adjusted Returns v/s
Returns Beta

News
Hardwyn India Ltd is Rated Hold
Hardwyn India Ltd is rated 'Hold' by MarketsMOJO, with this rating last updated on 24 March 2026. However, the analysis and financial metrics discussed here reflect the stock's current position as of 11 June 2026, providing investors with an up-to-date view of the company’s fundamentals, valuation, financial trends, and technical outlook.
Read full news article
Hardwyn India Ltd Reports Flat Quarterly Performance Amid Strong Long-Term Returns
Hardwyn India Ltd, a micro-cap player in the Furniture and Home Furnishing sector, has reported a flat financial performance for the quarter ended March 2026, signalling a stabilisation after a period of negative trends. Despite this, the company’s long-term returns remain robust, significantly outperforming the broader market benchmarks over the past five years.
Read full news article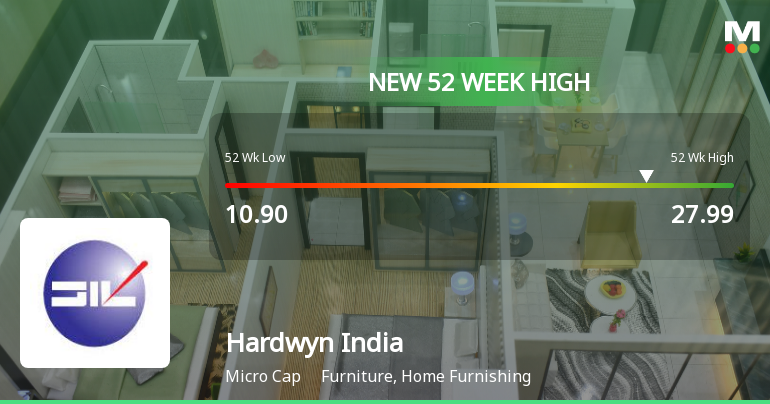
Broad-Based Technical Strength Lifts Hardwyn India Ltd to 52-Week High of Rs 27.99
With a remarkable 82.83% gain over the past year, Hardwyn India Ltd surged to a fresh 52-week high of Rs 27.99 on 1 Jun 2026, outpacing the Sensex which declined by 7.98% during the same period. This milestone underscores the stock's robust price momentum amid a market environment where the benchmark index trades below key moving averages.
Read full news article Announcements
Notice Of Extra-Ordinary General Meeting.
09-Jun-2026 | Source : BSEIntimation of the First Extra-ordinary General Meeting of the company to be held on Friday July 03 2026 at 02:00 P.M. through Video Conferencing (VC)/Other Audio Visual Means (OAVM)
Appointment of Company Secretary and Compliance Officer
05-Jun-2026 | Source : BSEMs. Diksha Rani has been appointed as Company Secretary and Compliance Officer w.e.f. 5th June 2026.
Announcement under Regulation 30 (LODR)-Change in Management
05-Jun-2026 | Source : BSEAppointment of Mr. Yogesh Garg as Additional Director Independent Non - Executive and resignation of Ms. Tanya Sayal as Non Executive Director
Corporate Actions

No Upcoming Board Meetings

No Dividend history available

Hardwyn India Ltd has announced 1:10 stock split, ex-date: 05 Jun 23

Hardwyn India Ltd has announced 2:5 bonus issue, ex-date: 27 Dec 24

No Rights history available
Quality key factors
Valuation key factors
Technicals key factors
 Technical Indicator Scale: Bearish, Mildly Bearish, Sideways, Mildly Bullish, Bullish Turned
 Shareholding Snapshot : Mar 2026
Shareholding Compare (%holding)
Non Institution
None
Held by 0 Schemes
Held by 3 FIIs (0.64%)
Rubaljeet Singh Sayal (23.7%)
Ginni Chadha (19.15%)
49.37%
Quarterly Results Snapshot (Standalone) - Mar'26 - QoQ

QoQ Growth in quarter ended Mar 2026 is 20.36% vs -10.62% in Dec 2025
QoQ Growth in quarter ended Mar 2026 is 108.54% vs -60.48% in Dec 2025
Half Yearly Results Snapshot (Consolidated) - Sep'25

Growth in half year ended Sep 2025 is 1.15% vs 34.55% in Sep 2024
Growth in half year ended Sep 2025 is 48.51% vs 107.72% in Sep 2024
Nine Monthly Results Snapshot (Consolidated) - Dec'25
YoY Growth in nine months ended Dec 2025 is 2.70% vs 27.84% in Dec 2024
YoY Growth in nine months ended Dec 2025 is 4.38% vs 35.80% in Dec 2024
Annual Results Snapshot (Standalone) - Mar'26
YoY Growth in year ended Mar 2026 is 13.06% vs 4.47% in Mar 2025
YoY Growth in year ended Mar 2026 is 18.23% vs 10.26% in Mar 2025
About Hardwyn India Ltd

Company Coordinates


