
Compare Haria Apparels with Similar Stocks
Dashboard
With a Operating Losses, the company has a Weak Long Term Fundamental Strength
- Low ability to service debt as the company has a high Debt to EBITDA ratio of -0.25 times
- The company has reported losses. Due to this company has reported negative ROCE
Flat results in Mar 26
Risky - Negative EBITDA
Below par performance in long term as well as near term
Stock DNA
Garments & Apparels
INR 8 Cr (Micro Cap)
11.00
23
0.00%
0.02
10.38%
1.15
Total Returns (Price + Dividend) 
Haria Apparels for the last several years.
Risk Adjusted Returns v/s
Returns Beta

News
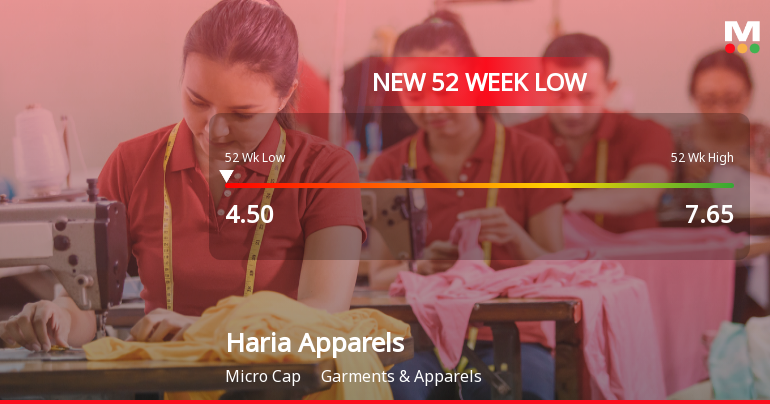
Markets Rally, But Haria Apparels Ltd Sinks to 52-Week Low in Stock-Specific Sell-Off
While the broader market indices showed resilience, Haria Apparels Ltd plunged to a fresh 52-week low of Rs 4.5 on 16 Jul 2026, marking a sharp intraday decline of 19.64%. This stark underperformance contrasts sharply with the Sensex’s modest gain of 0.41% on the same day.
Read full news article
Haria Apparels Ltd Downgraded to Strong Sell Amid Technical and Financial Weaknesses
Haria Apparels Ltd has seen its investment rating downgraded from Sell to Strong Sell as of 1 July 2026, reflecting deteriorating technical indicators and persistent financial challenges. Despite some market-beating returns over the medium term, the company’s weak fundamentals and sideways technical trend have raised concerns among investors and analysts alike.
Read full news article
Haria Apparels Ltd Upgraded to Sell on Technical Improvements Despite Weak Fundamentals
Haria Apparels Ltd has seen its investment rating upgraded from Strong Sell to Sell as of 30 June 2026, driven primarily by a shift in technical indicators despite ongoing fundamental challenges. The garment and apparels company’s Mojo Score improved to 33.0, reflecting a mildly bullish technical outlook, although its financial performance remains subdued with operating losses and weak long-term fundamentals.
Read full news article Announcements
Closure of Trading Window
23-Jun-2026 | Source : BSEThis is to inform you that the Trading Window of the Company will remain closed from 1st July 2026 until the expiry of 48 hours after the declaration of Financial Results for the quarter ended 30th June 2026.
Board Meeting Outcome for Outcome Of Board Meeting And Submission Of Audited Financial Results For The Year Ended March 31St 2026.
30-May-2026 | Source : BSEPursuant to Regulation 30 of the Securities and Exchange Board of India (Listing Obligations and Disclosure Requirements) Regulations 2015 we would like to inform that at the meeting of the Board of Directors of the Company held on Saturday 30th May 2026 the Board of Directors inter alia : 1 Approved the Audited Financial Results for quarter and year ended 31st March 2026. Accordingly we enclose herewith the following documents for the quarter and year ended 31st March 2026 : a. Audited Financial Results of the Company. b. Auditors Reports issued by the Statutory Auditors on the Financial Results of the Company. c. Statement of Asset and Liabilities as on 31st March 2026. d. Declaration on the unmodified opinion in the Auditors Report on Financial Results of the Company. You are requested to kindly take note of the same.
Outcome Of Board Meeting And Submission Of Audited Financial Results For The Year Ended March 31St 2026.
30-May-2026 | Source : BSEPlease find enclosed herewith approved Audited Financial Results for the quarter and year ended 31st March 2026.
Corporate Actions

No Upcoming Board Meetings

No Dividend history available

No Splits history available

No Bonus history available

No Rights history available
Quality key factors
Valuation key factors
Technicals key factors
 Technical Indicator Scale: Bearish, Mildly Bearish, Sideways, Mildly Bullish, Bullish Turned
 Shareholding Snapshot : Mar 2026
Shareholding Compare (%holding)
Promoters
None
Held by 2 Schemes (0.01%)
Held by 0 FIIs
Bimal Kantilal Haria (58.5%)
None
38.23%
Quarterly Results Snapshot (Standalone) - Mar'26 - YoY
YoY Growth in quarter ended Mar 2026 is 0.00% vs 0.00% in Mar 2025

YoY Growth in quarter ended Mar 2026 is -26.47% vs 240.00% in Mar 2025
Half Yearly Results Snapshot (Standalone) - Sep'25
Growth in half year ended Sep 2025 is 0.00% vs 0.00% in Sep 2024

Growth in half year ended Sep 2025 is 112.00% vs -58.33% in Sep 2024
Nine Monthly Results Snapshot (Standalone) - Dec'25
YoY Growth in nine months ended Dec 2025 is 0.00% vs 0.00% in Dec 2024
YoY Growth in nine months ended Dec 2025 is -6.00% vs -37.50% in Dec 2024
Annual Results Snapshot (Standalone) - Mar'26
YoY Growth in year ended Mar 2026 is 0.00% vs 0.00% in Mar 2025
YoY Growth in year ended Mar 2026 is -15.48% vs -5.62% in Mar 2025
About Haria Apparels Ltd

Company Coordinates


