Harsha Engg Intl

  • Market Cap: Small Cap
  • Industry: Other Industrial Products
  • ISIN: INE0JUS01029
  • NSEID: HARSHA
  • BSEID: 543600
INR
312.90
-11.1 (-3.43%)
BSENSE

Mar 30

BSE+NSE Vol: 61.96 k

  • Price Points
  • Score
  • Mojo Parameters
  • Total Return
  • News and Corporate Actions
  • Key factors
  • Shareholding
  • Financials
  • CompanyCV
stock-summaryPrice Point
High/Low

1Day

52 Week

Valuation
Technical
Day's Volume

CASH

61.96 k (2.03%) Volume

Shareholding (Dec 2025)

FII

0.41%

Held by 25 FIIs

DII

0.03%

Held by 14 DIIs

Promoter

75.00%

What does Harsha Engg Intl do?

06-Jun-2025

Harsha Engineers International Ltd is a Small Cap company in the Other Industrial Products industry, incorporated in 2010, with recent net sales of 373 Cr and a net profit of -2 Cr as of March 2025. Key metrics include a P/E of 33.00 and a market cap of Rs 3,997 Cr.

Overview:<BR>Harsha Engineers International Ltd operates in the Other Industrial Products industry and is categorized as a Small Cap company.<BR><BR>History:<BR>The company was incorporated as a Private Limited Company on December 11, 2010. It underwent a name change to Harsha Engineers International Private Limited following a scheme approved by the Hon'ble National Company Law Tribunal on December 23, 2021, with a fresh Certificate of Incorporation issued on December 31, 2021. The latest reported quarter for sales and profit is March 2025.<BR><BR>Financial Snapshot:<BR>Most recent Net Sales: 373 Cr (Quarterly Results - Mar 2025) <BR>Most recent Net Profit: -2 Cr (Quarterly Results - Mar 2025) <BR>Market-cap value: Rs 3,997 Cr (Small Cap)<BR><BR>Key Metrics:<BR>P/E: 33.00 <BR>Industry P/E: 38 <BR>Dividend Yield: 0.24% <BR>Debt-Equity: -0.09 <BR>Return on Equity: 9.33% <BR>Price to Book: 3.05 <BR><BR>Contact Details:<BR>Registrar Address: Not available. <BR>Phone: N/A <BR>Email: N/A <BR>Website: N/A

View full answer

When is the next results date for Harsha Engg Intl?

06-Jun-2025

No Upcoming Board Meetings

Has Harsha Engg Intl declared dividend?

06-Jun-2025

Harsha Engineers International Ltd has declared a 10% dividend, amounting to ₹1 per share, with an ex-date of September 9, 2024. Despite the dividend declaration, the company has experienced negative total returns in the short term, with modest positive returns over longer periods.

Harsha Engineers International Ltd has declared a 10% dividend.<BR><BR>Dividend Details:<BR>- Percentage announced: 10%<BR>- Amount per share: 1 per share<BR>- Ex-date: 09 Sep 24<BR><BR>Dividend Yield: 0.24%.<BR><BR>Total Returns by Period:<BR>In the last 6 months, the price return was -18.91%, the dividend return was 0%, resulting in a total return of -18.91%.<BR><BR>Over the past year, the price return was -11.28%, the dividend return was 0.18%, leading to a total return of -11.1%.<BR><BR>In the 2-year period, the price return was 0.9%, the dividend return was 0.45%, culminating in a total return of 1.35%.<BR><BR>For the 3-year period, there was no price return or dividend return, resulting in a total return of 0.0%.<BR><BR>In the 4-year period, both the price return and dividend return were 0%, leading to a total return of 0.0%.<BR><BR>Over the last 5 years, there was again no price return or dividend return, resulting in a total return of 0.0%.<BR><BR>Overall, while Harsha Engineers International Ltd has declared a dividend, the total returns over various periods indicate a mixed performance, with negative returns in the short term and modest positive returns over the longer term.

View full answer

Who are the peers of the Harsha Engg Intl?

03-Jun-2025

Harsha Engg Intl's peers include PTC Industries, Inox India, Esab India, KRN Heat Exchan, Kirloskar Indus., Ador Welding, Diffusion Eng, Oriental Rail, Mallcom (India), and Sealmatic India. In terms of performance, Harsha Engg Intl has a 1-year return of -21.89%, better than Kirloskar Indus. (-38.01%) but worse than PTC Industries (55.24%).

Peers: The peers of Harsha Engg Intl are PTC Industries, Inox India, Esab India, KRN Heat Exchan, Kirloskar Indus., Ador Welding, Diffusion Eng, Oriental Rail, Mallcom (India), and Sealmatic India.<BR><BR>Quality Snapshot: Excellent management risk is observed at Inox India and Esab India, while Good management risk is found at KRN Heat Exchan and Ador Welding. Average management risk is present at PTC Industries, Kirloskar Indus., Harsha Engg Intl, Diffusion Eng, Oriental Rail, and Mallcom (India). For Growth, Excellent growth is noted at Kirloskar Indus., while Good growth is seen at KRN Heat Exchan and Sealmatic India. Average growth is reported at PTC Industries, Ador Welding, and Diffusion Eng, while Below Average growth is found at Inox India, Esab India, Harsha Engg Intl, Oriental Rail, and Mallcom (India). In terms of Capital Structure, Excellent capital structure is observed at Inox India, Esab India, KRN Heat Exchan, Ador Welding, Diffusion Eng, Mallcom (India), and Sealmatic India, while Good capital structure is noted at Kirloskar Indus., and Average capital structure is present at PTC Industries, Harsha Engg Intl, and the rest.<BR><BR>Return Snapshot: The peer with the highest 1-year return is PTC Industries at 55.24%, while the peer with the lowest is Kirloskar Indus. at -38.01%. Harsha Engg Intl's 1-year return of -21.89% is better than Kirloskar Indus. but worse than PTC Industries. Additionally, the peers with negative six-month returns include Kirloskar Indus., Esab India, KRN Heat Exchan, Oriental Rail, and Mallcom (India).

View full answer

Who are in the management team of Harsha Engg Intl?

16-Jul-2025

As of March 2022, the management team of Harsha Engg Intl includes Rajendra S Shah (Chairman), Harish Rangwala (Managing Director), Vishal Rangwala (CEO), and several other directors, along with Kiran Mohanty as Company Secretary. They oversee the company's strategic direction and management.

As of March 2022, the management team of Harsha Engg Intl includes the following individuals:<BR><BR>1. Rajendra S Shah - Chairman & Wholetime Director<BR>2. Harish Rangwala - Managing Director<BR>3. Vishal Rangwala - Whole Time Director & CEO<BR>4. Pilak Rajendra Shah - Whole Time Director & COO<BR>5. Hetal Brijesh Ukani - Whole-time Director<BR>6. Ambar J Patel - Independent Director<BR>7. Neharika Vohra - Independent Director<BR>8. Kunal Dilipbhai Shah - Independent Director<BR>9. BHUSHAN CHELARAM PUNANI - Independent Director<BR>10. Ramakrishnan Kasinathan - Independent Director<BR>11. Kiran Mohanty - Company Secretary & Compliance Officer<BR><BR>This team is responsible for the strategic direction and management of the company.

View full answer

Who are the top shareholders of the Harsha Engg Intl?

17-Jul-2025

The top shareholders of Harsha Engg International include promoter Shah Rajendra Shantilal with 13.09%, mutual funds holding 11.72% (led by DSP Small Cap Fund at 7.17%), individual investors at 10.47%, and foreign institutional investors with a combined stake of 0.88%.

The top shareholders of Harsha Engg International include the promoters, who hold the majority of the shares. The promoter with the highest holding is Shah Rajendra Shantilal, owning 13.09%. Additionally, mutual funds hold 11.72% of the shares across three schemes, with the highest public shareholder being DSP Small Cap Fund at 7.17%. Individual investors collectively hold 10.47%, while foreign institutional investors (FIIs) have a smaller stake of 0.88% held by 23 different FIIs.

View full answer

How big is Harsha Engg Intl?

24-Jul-2025

As of 24th July, Harsha Engineers International Ltd has a market capitalization of 3,694.00 Cr, with recent Net Sales of 1,407.65 Cr and a Net Profit of 89.31 Cr. Shareholder's Funds are 1,175.28 Cr and Total Assets amount to 1,566.60 Cr as of March 2024.

As of 24th July, Harsha Engineers International Ltd has a market capitalization of 3,694.00 Cr, classifying it as a Small Cap company.<BR><BR>In the latest four quarters, the company reported Net Sales of 1,407.65 Cr and a Net Profit of 89.31 Cr.<BR><BR>The latest annual period for the balance sheet is March 2024, with Shareholder's Funds amounting to 1,175.28 Cr and Total Assets of 1,566.60 Cr.

View full answer

Is Harsha Engg Intl overvalued or undervalued?

25-Nov-2025

As of November 24, 2025, Harsha Engg Intl is considered undervalued with a PE Ratio of 28.01, significantly lower than its expensive peers like Thermax and BEML Ltd, and despite a year-to-date return of -22.08% compared to the Sensex's 8.65%, it shows potential for recovery and growth.

As of 24 November 2025, Harsha Engg Intl has moved from a fair to a very attractive valuation grade, indicating a significant improvement in its perceived value. The company is currently considered undervalued. Key ratios include a PE Ratio of 28.01, an EV to EBITDA of 19.15, and a PEG Ratio of 0.00, which suggests that the stock may be undervalued relative to its growth prospects.<BR><BR>In comparison to its peers, Harsha Engg Intl's PE Ratio is notably lower than that of Thermax, which stands at 57.24, and BEML Ltd at 51.32, both of which are categorized as expensive. This reinforces the notion that Harsha Engg Intl is positioned favorably within its industry. Additionally, the company's recent stock performance has lagged behind the Sensex, with a year-to-date return of -22.08% compared to the Sensex's 8.65%, further suggesting potential for recovery and growth.

View full answer

How has been the historical performance of Harsha Engg Intl?

01-Dec-2025

Harsha Engg Intl has shown steady growth in net sales and total operating income, increasing from 1,321.48 Cr in Mar'22 to 1,407.65 Cr in Mar'25, but faced declining profitability with profit after tax dropping from 123.28 Cr to 89.31 Cr. Total assets rose significantly, while cash flow from operating activities improved from 36.00 Cr to 206.00 Cr, indicating better cash generation capabilities.

Answer:<BR>The historical performance of Harsha Engg Intl shows a steady growth in net sales and total operating income over the past four years, with net sales increasing from 1,321.48 Cr in Mar'22 to 1,407.65 Cr in Mar'25. The total operating income followed a similar trend, rising from 1,321.48 Cr to 1,407.65 Cr during the same period. However, the operating profit (PBDIT) exhibited fluctuations, peaking at 219.08 Cr in Mar'23 and then declining to 212.67 Cr in Mar'25. Profit before tax also saw a decrease from 167.12 Cr in Mar'23 to 135.68 Cr in Mar'25, while profit after tax dropped from 123.28 Cr to 89.31 Cr in the same timeframe. The earnings per share (EPS) decreased from 13.54 in Mar'23 to 9.81 in Mar'25, reflecting a decline in profitability. On the balance sheet, total assets grew from 1,158.26 Cr in Mar'22 to 1,691.06 Cr in Mar'25, with total liabilities also increasing from 1,158.26 Cr to 1,691.06 Cr. The company maintained a stable equity capital of 91.04 Cr over the last two years, while reserves significantly increased from 444.61 Cr in Mar'22 to 1,163.10 Cr in Mar'25. Cash flow from operating activities improved from 36.00 Cr in Mar'22 to 206.00 Cr in Mar'25, indicating better cash generation capabilities.<BR><BR>Breakdown:<BR>Harsha Engg Intl has demonstrated a consistent upward trajectory in net sales and total operating income, with figures rising from 1,321.48 Cr in Mar'22 to 1,407.65 Cr in Mar'25. Despite this growth, the operating profit (PBDIT) has fluctuated, reaching a high of 219.08 Cr in Mar'23 before declining to 212.67 Cr in Mar'25. Profit before tax and profit after tax both decreased over the same period, indicating challenges in maintaining profitability, with profit after tax falling from 123.28 Cr to 89.31 Cr. The company's earnings per share also declined, reflecting the impact of reduced profits. On the balance sheet, total assets increased significantly, from 1,158.26 Cr to 1,691.06 Cr, alongside a rise in total liabilities, which mirrored this growth. The equity capital remained stable, while reserves saw substantial growth, indicating a strengthening financial position. Cash flow from operating activities improved markedly, showcasing enhanced cash generation from operations.

View full answer

Is Harsha Engg Intl technically bullish or bearish?

02-Dec-2025

As of December 1, 2025, Harsha Engg Intl has shifted to a bearish trend, indicated by negative signals from multiple technical indicators, including the MACD, Bollinger Bands, and moving averages, alongside a year-to-date return of -22.61% compared to the Sensex's 9.60%.

As of 1 December 2025, the technical trend for Harsha Engg Intl has changed from sideways to bearish. The current technical stance is bearish with a strong indication from multiple indicators. The weekly MACD is bearish, supported by bearish signals from both the Bollinger Bands and the daily moving averages. The KST is also bearish on a weekly basis. There are no significant signals from the RSI or Dow Theory, indicating a lack of upward momentum. Overall, the bearish sentiment is reinforced by the stock's poor performance relative to the Sensex over various time frames, particularly the year-to-date return of -22.61% compared to the Sensex's 9.60%.

View full answer

Are Harsha Engineers International Ltd latest results good or bad?

05-Feb-2026

Harsha Engineers International Ltd's latest results show a 25.83% year-on-year increase in net profit to ₹36.44 crore, but a 3.93% decline from the previous quarter, alongside a slight revenue growth. While the company remains profitable, it faces margin compression and cost pressures, indicating cautious optimism for investors.

Harsha Engineers International Ltd's latest results present a mixed picture. In Q2 FY26, the company reported a net profit of ₹36.44 crore, which is a significant year-on-year increase of 25.83%. However, this represents a decline of 3.93% compared to the previous quarter. The net sales for the same period were ₹378.34 crore, showing a year-on-year growth of 7.31% and a sequential increase of 3.57%.<BR><BR>While the revenue growth indicates resilience in demand, the operating margin has come under pressure, declining to 14.14% from 15.17% in the previous quarter, marking a 103-basis-point drop. This decline in margins reflects ongoing cost pressures that the company has been facing.<BR><BR>Overall, the results highlight a company that is maintaining profitability and showing some growth, but also grappling with margin compression and a slight sequential decline in profit. The current financial performance suggests cautious optimism, but investors should be aware of the challenges related to cost management and margin sustainability.

View full answer

Should I buy, sell or hold Harsha Engineers International Ltd?

11-Feb-2026

Why is Harsha Engineers International Ltd falling/rising?

27-Mar-2026

As of 26-Mar, Harsha Engineers International Ltd's stock is at Rs 333.00, down 0.3%, and has significantly underperformed with a year-to-date decline of 11.75%. The stock is near its 52-week low and shows a negative trend, with declining investor participation and poor long-term growth.

As of 26-Mar, Harsha Engineers International Ltd's stock price is falling, currently at Rs 333.00, which reflects a decrease of Rs 1.0 or 0.3%. The stock has underperformed significantly over various periods, with a 1-week decline of 2.66% and a 1-month drop of 11.12%, compared to the Sensex's declines of 1.87% and 8.51%, respectively. Year-to-date, the stock is down 11.75%, slightly worse than the Sensex's 11.67% decline, and over the past year, it has generated a return of -14.94%, while the benchmark has only fallen by 3.52%.<BR><BR>Today's performance indicates that the stock is close to its 52-week low, being just 2.4% away from Rs 325. Additionally, it has underperformed its sector by 2.48% today. The stock reached an intraday high of Rs 349.9, but the overall trend remains negative as it is trading below all key moving averages (5-day, 20-day, 50-day, 100-day, and 200-day). <BR><BR>Investor participation appears to be declining, with delivery volume dropping by 14.56% compared to the 5-day average. Despite having a low debt-to-equity ratio and a reasonable return on equity (ROE) of 9.6, the company has shown poor long-term growth, with net sales growing at an annual rate of only 3.18% over the last five years. This consistent underperformance against benchmarks and the flat results reported in December have contributed to the stock's downward trajectory.

View full answer

Why is Harsha Engineers International Ltd falling/rising?

28-Mar-2026

As of 27-Mar, Harsha Engineers International Ltd's stock price is declining, currently at Rs. 324.00, reflecting a significant underperformance against benchmark indices and weak financial indicators. The stock has reached a new 52-week low and is trading below all major moving averages, indicating a bearish trend and concerns about long-term growth potential.

As of 27-Mar, Harsha Engineers International Ltd's stock price is falling, currently at Rs. 324.00, which reflects a decrease of Rs. 10.3 or 3.08%. This decline is part of a broader trend, as the stock has underperformed significantly against the benchmark indices over various periods, including a 14.08% drop in the past year compared to a 5.18% decline in the Sensex.<BR><BR>Today's trading activity shows that the stock reached a new 52-week low of Rs. 322 and has been highly volatile, with an intraday volatility of 5.94%. Although the stock opened with a gain of 4.7%, it quickly fell, indicating a trend reversal after two days of consecutive gains. The stock is currently trading below its 5-day, 20-day, 50-day, 100-day, and 200-day moving averages, suggesting a bearish trend.<BR><BR>Additionally, the company's financial performance raises concerns, with net sales growing at a modest annual rate of 3.18% and operating profit at only 1.51% over the last five years. The return on capital employed (ROCE) is at its lowest at 11.28%, and cash and cash equivalents have also reached a low of Rs. 22.66 crore. These factors contribute to a perception of poor long-term growth potential, further influencing investor sentiment negatively.<BR><BR>In summary, the combination of recent price movements, underperformance against benchmarks, and weak financial indicators are driving the stock price of Harsha Engineers International Ltd downward.

View full answer

Why is Harsha Engineers International Ltd falling/rising?

29-Mar-2026

As of 28-Mar, Harsha Engineers International Ltd's stock price is at Rs. 324.00, down 3.08% and hitting a 52-week low. The stock has shown significant declines over the past month and year, indicating a bearish trend and poor long-term growth prospects.

As of 28-Mar, Harsha Engineers International Ltd's stock price is falling, currently at Rs. 324.00, reflecting a decrease of Rs. 10.3 or 3.08%. The stock has recently hit a new 52-week low of Rs. 322 today, indicating a downward trend. Over the past week, the stock has declined by 4.47%, and it has also underperformed significantly over the last month with a drop of 12.33%, compared to a 9.48% decline in the Sensex.<BR><BR>The stock's performance today has been characterized by high volatility, with an intraday volatility of 5.94%. Although it opened with a gain of 4.7% and reached an intraday high of Rs. 351, it ultimately fell to its day's low of Rs. 322. This pattern suggests a trend reversal after two consecutive days of gains, contributing to the current decline.<BR><BR>Moreover, Harsha Engineers is trading below its moving averages across various time frames, indicating a bearish trend. The engineering sector, in which the company operates, has also seen a decline of 2.92%, further impacting the stock's performance. Despite some positive factors, such as a low debt-to-equity ratio and a fair valuation compared to peers, the company's long-term growth prospects appear poor, with net sales and operating profit growing at low rates over the past five years. This consistent underperformance against benchmarks over the last three years, along with a return of -14.08% in the past year, reinforces the reasons for the stock's decline.

View full answer

Why is Harsha Engineers International Ltd falling/rising?

30-Mar-2026

As of 29-Mar, Harsha Engineers International Ltd's stock price is at Rs. 324.00, reflecting a decline of 3.08% and a new 52-week low of Rs. 322. The stock has shown high volatility and poor long-term growth prospects, contributing to its significant underperformance compared to market benchmarks.

As of 29-Mar, Harsha Engineers International Ltd's stock price is falling, currently at Rs. 324.00, which reflects a decrease of Rs. 10.3 or 3.08%. The stock has recently hit a new 52-week low of Rs. 322 today, indicating a significant decline in its value. Over the past week, the stock has decreased by 4.47%, and it has shown a substantial drop of 12.33% over the last month, which is notably worse than the Sensex's decline of 9.48% during the same period.<BR><BR>The stock's performance has been characterized by high volatility, with an intraday volatility of 5.94%. It opened with a gain of 4.7% today but quickly fell to its intraday low of Rs. 322, suggesting a lack of sustained buying interest. Additionally, Harsha Engineers is trading below all its moving averages, including the 5-day, 20-day, 50-day, 100-day, and 200-day averages, which typically signals a bearish trend.<BR><BR>Furthermore, the company's long-term growth prospects appear weak, as evidenced by a low annual growth rate in net sales of 3.18% and operating profit of 1.51% over the last five years. The stock has consistently underperformed against benchmarks, generating a return of -14.08% over the past year, which is significantly lower than the BSE500's performance. Despite a low debt-to-equity ratio and a fair valuation compared to peers, these factors have not been sufficient to counteract the negative sentiment surrounding the stock. Overall, the combination of poor recent performance, high volatility, and weak long-term growth indicators contributes to the current decline in Harsha Engineers International Ltd's stock price.

View full answer
iScoreScore
Click here to find our call on this stock
Strong Sell
Sell
Hold
Buy
Strong Buy

Dashboard

1

Poor long term growth as Net Sales has grown by an annual rate of 3.18% and Operating profit at 1.51% over the last 5 years

 
2

Flat results in Dec 25

3

Consistent Underperformance against the benchmark over the last 3 years

stock-summaryMojo Parameters

Mojo Parameters

Loading Valuation Snapshot...

Stock DNA

stock-summary
Industry

Other Industrial Products

stock-summary
Market cap

INR 2,950 Cr (Small Cap)

stock-summary
P/E

21.00

stock-summary
Industry P/E

31

stock-summary
Dividend Yield

0.31%

stock-summary
Debt Equity

0.03

stock-summary
Return on Equity

9.61%

stock-summary
Price to Book

2.25

Revenue and Profits:
Net Sales:
409 Cr
(Quarterly Results - Dec 2025)
Net Profit:
34 Cr
stock-summaryTotal Returns
Total Returns (Price + Dividend) stock-summary
Dividend Yield (0.31%)
TimePeriod
Price Return
Dividend Return
Total Return
3 Months
-16.56%
0%
-16.56%
6 Months
-19.94%
0%
-19.94%
1 Year
-16.22%
0.28%
-15.94%
2 Years
-21.91%
0.49%
-21.42%
3 Years
-5.08%
0.73%
-4.35%
4 Years
0%
0%
0.0%
5 Years
0%
0%
0.0%

Latest dividend: 1 per share ex-dividend date: Aug-29-2025

Risk Adjusted Returns v/s stock-summary
Returns Beta
Icon
Beta has not been calculated since enough price history is not available
stock-summaryNews & Corporate Actions

News

Why is Harsha Engineers International Ltd falling/rising?

Recent Price Movement and Market Performance

On 30 March, Harsha Engineers International opened with a gap down of 3.1%, continuing a downward trajectory that has persisted for two consecutive days. Over this brief period, the stock has lost 6.4% in value, underperforming its sector by 1.78% on the day. Intraday, the share price touched a low of ₹311.05, setting a new 52-week low, signalling investor caution and bearish sentiment. The stock is currently trading below all key moving averages, including the 5-day, 20-day, 50-day, 100-day, and 200-day averages, which typically indicates a weak technical outlook.

Comparative Returns Highlight Underperformance

When analysing returns against the benchmark Sensex, Harsha Engineers International has con...

Read full news article
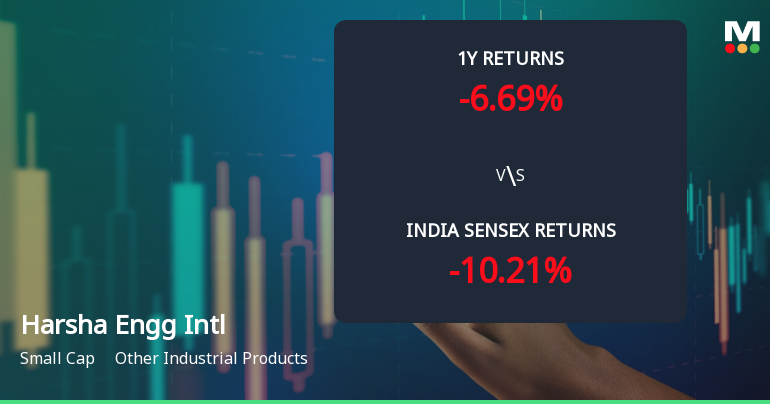
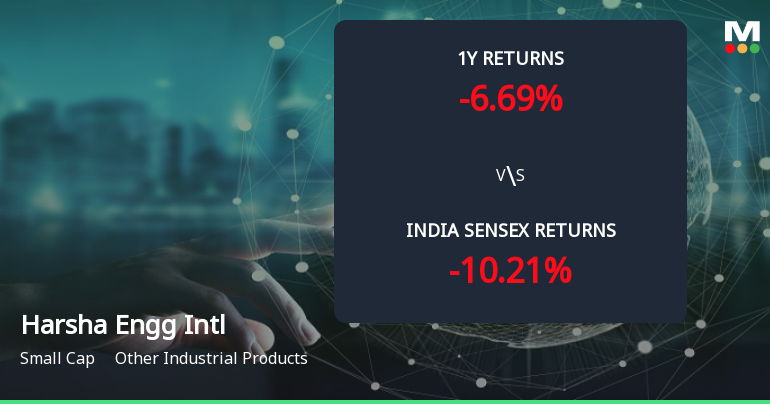
Announcements stock-summary

Closure of Trading Window

24-Mar-2026 | Source : BSE

Closure of Trading Window Closure

Announcement under Regulation 30 (LODR)-Earnings Call Transcript

11-Feb-2026 | Source : BSE

Transcript of Earning Call for the quarter and nine-month ended 31st December 2025

Announcement under Regulation 30 (LODR)-Newspaper Publication

06-Feb-2026 | Source : BSE

Newspaper Publication of Unaudited Financial Results for the quarter and nine-month ended December 31 2025

Corporate Actions stock-summary

stock-summary
BOARD MEETING

No Upcoming Board Meetings

stock-summary
DIVIDEND

Harsha Engineers International Ltd has declared 10% dividend, ex-date: 29 Aug 25

stock-summary
SPLITS

No Splits history available

stock-summary
BONUS

No Bonus history available

stock-summary
RIGHTS

No Rights history available

stock-summaryKey Factors

Quality key factors stock-summary

Factor
Value
Sales Growth (5y)
3.18%
EBIT Growth (5y)
1.51%
EBIT to Interest (avg)
12.17
Debt to EBITDA (avg)
1.32
Net Debt to Equity (avg)
0.03
Sales to Capital Employed (avg)
1.04
Tax Ratio
32.77%
Dividend Payout Ratio
8.17%
Pledged Shares
0
Institutional Holding
12.83%
ROCE (avg)
13.38%
ROE (avg)
10.04%

Valuation key factors

Factor
Value
P/E Ratio
21
Industry P/E
31
Price to Book Value
2.17
EV to EBIT
18.32
EV to EBITDA
14.34
EV to Capital Employed
2.13
EV to Sales
1.89
PEG Ratio
5.75
Dividend Yield
0.32%
ROCE (Latest)
10.71%
ROE (Latest)
9.61%

Technicals key factors

Indicator
Weekly
Monthly
MACD
Bearish
Mildly Bearish
RSI
No Signal
No Signal
Bollinger Bands
Bearish
Bearish
Moving Averages
Bearish (Daily)
KST
Bearish
Dow Theory
Mildly Bearish
Mildly Bearish
OBV
No Trend
Mildly Bullish
stock-summary Technical Indicator Scale: Bearish, Mildly Bearish, Sideways, Mildly Bullish, Bullish  Turned 
stock-summaryShareholding
Shareholding Snapshot : Dec 2025stock-summary
Shareholding Compare (%holding) stock-summary
Majority shareholders

Promoters

Pledged Promoter Holdings

None

Mutual Funds

Held by 4 Schemes (12.39%)

FIIs

Held by 25 FIIs (0.41%)

Promoter with highest holding

Shah Rajendra Shantilal (13.19%)

Highest Public shareholder

Dsp Small Cap Fund (7.68%)

Individual Investors Holdings

10.42%

stock-summaryFinancial
[
  {
    "link": "quarterly",
    "btn_text": "All Quarterly Results",
    "header": "Quarterly Results Snapshot (Consolidated) - Dec'25 - QoQ",
    "rhs": [
      {
        "prefix": "Net Sales ",
        "suffix": "QoQ Growth in quarter ended Dec 2025 is 8.17% vs 3.57% in Sep 2025",
        "dir": 1
      },
      {
        "prefix": "Consolidated Net Profit ",
        "suffix": "QoQ Growth in quarter ended Dec 2025 is -7.79% vs -3.93% in Sep 2025",
        "dir": -1
      }
    ],
    "table": {
      "header": [
        "Dec'25",
        "Sep'25",
        "Change(%)"
      ],
      "body": [
        {
          "field": "Net Sales",
          "val1": "409.25",
          "val2": "378.34",
          "chgp": "8.17%",
          "chgp_class": "positive"
        },
        {
          "field": "Operating Profit (PBDIT) excl Other Income",
          "val1": "57.31",
          "val2": "53.51",
          "chgp": "7.10%",
          "chgp_class": "positive"
        },
        {
          "field": "Interest",
          "val1": "4.84",
          "val2": "3.05",
          "chgp": "58.69%",
          "chgp_class": "negative"
        },
        {
          "field": "Exceptional Items",
          "val1": "0.00",
          "val2": "0.00",
          "chgp": "",
          "chgp_class": "neutral"
        },
        {
          "field": "Consolidate Net Profit",
          "val1": "33.60",
          "val2": "36.44",
          "chgp": "-7.79%",
          "chgp_class": "negative"
        },
        {
          "field": "Operating Profit Margin (Excl OI)",
          "val1": "14.00%",
          "val2": "14.14%",
          "chgp": "-0.14%",
          "chgp_class": "negative"
        }
      ]
    }
  },
  {
    "link": "half-yearly",
    "btn_text": "All Half Yearly Results",
    "header": "Half Yearly Results Snapshot (Consolidated) - Sep'25",
    "rhs": [
      {
        "prefix": "Net Sales ",
        "suffix": " Growth in half year ended Sep 2025 is 6.88% vs 1.21% in Sep 2024",
        "dir": 1
      },
      {
        "prefix": "Consolidated Net Profit ",
        "suffix": " Growth in half year ended Sep 2025 is 14.40% vs 44.56% in Sep 2024",
        "dir": -1
      }
    ],
    "table": {
      "header": [
        "Sep'25",
        "Sep'24",
        "Change(%)"
      ],
      "body": [
        {
          "field": "Net Sales",
          "val1": "743.63",
          "val2": "695.74",
          "chgp": "6.88%",
          "chgp_class": "positive"
        },
        {
          "field": "Operating Profit (PBDIT) excl Other Income",
          "val1": "108.94",
          "val2": "97.01",
          "chgp": "12.30%",
          "chgp_class": "positive"
        },
        {
          "field": "Interest",
          "val1": "5.62",
          "val2": "5.18",
          "chgp": "8.49%",
          "chgp_class": "negative"
        },
        {
          "field": "Exceptional Items",
          "val1": "0.00",
          "val2": "0.00",
          "chgp": "",
          "chgp_class": "neutral"
        },
        {
          "field": "Consolidate Net Profit",
          "val1": "74.37",
          "val2": "65.01",
          "chgp": "14.40%",
          "chgp_class": "positive"
        },
        {
          "field": "Operating Profit Margin (Excl OI)",
          "val1": "14.65%",
          "val2": "13.94%",
          "chgp": "0.71%",
          "chgp_class": "positive"
        }
      ]
    }
  },
  {
    "link": "nine-monthly",
    "btn_text": "All Nine Monthly Results",
    "header": "Nine Monthly Results Snapshot (Consolidated) - Dec'25",
    "rhs": [
      {
        "prefix": "Net Sales ",
        "suffix": "YoY Growth in nine months ended Dec 2025 is 11.42% vs 2.25% in Dec 2024",
        "dir": 1
      },
      {
        "prefix": "Consolidated Net Profit ",
        "suffix": "YoY Growth in nine months ended Dec 2025 is 17.74% vs 22.84% in Dec 2024",
        "dir": -1
      }
    ],
    "table": {
      "header": [
        "Dec'25",
        "Dec'24",
        "Change(%)"
      ],
      "body": [
        {
          "field": "Net Sales",
          "val1": "1,152.88",
          "val2": "1,034.68",
          "chgp": "11.42%",
          "chgp_class": "positive"
        },
        {
          "field": "Operating Profit (PBDIT) excl Other Income",
          "val1": "166.25",
          "val2": "139.78",
          "chgp": "18.94%",
          "chgp_class": "positive"
        },
        {
          "field": "Interest",
          "val1": "10.46",
          "val2": "7.31",
          "chgp": "43.09%",
          "chgp_class": "negative"
        },
        {
          "field": "Exceptional Items",
          "val1": "0.00",
          "val2": "0.00",
          "chgp": "",
          "chgp_class": "neutral"
        },
        {
          "field": "Consolidate Net Profit",
          "val1": "107.97",
          "val2": "91.70",
          "chgp": "17.74%",
          "chgp_class": "positive"
        },
        {
          "field": "Operating Profit Margin (Excl OI)",
          "val1": "14.42%",
          "val2": "13.51%",
          "chgp": "0.91%",
          "chgp_class": "positive"
        }
      ]
    }
  },
  {
    "link": "annual",
    "btn_text": "All Annual Results",
    "header": "Annual Results Snapshot (Consolidated) - Mar'25",
    "rhs": [
      {
        "prefix": "Net Sales ",
        "suffix": "YoY Growth in year ended Mar 2025 is 1.10% vs 2.07% in Mar 2024",
        "dir": -1
      },
      {
        "prefix": "Consolidated Net Profit ",
        "suffix": "YoY Growth in year ended Mar 2025 is -19.85% vs -9.61% in Mar 2024",
        "dir": -1
      }
    ],
    "table": {
      "header": [
        "Mar'25",
        "Mar'24",
        "Change(%)"
      ],
      "body": [
        {
          "field": "Net Sales",
          "val1": "1,407.65",
          "val2": "1,392.30",
          "chgp": "1.10%",
          "chgp_class": "positive"
        },
        {
          "field": "Operating Profit (PBDIT) excl Other Income",
          "val1": "174.94",
          "val2": "171.35",
          "chgp": "2.10%",
          "chgp_class": "positive"
        },
        {
          "field": "Interest",
          "val1": "8.77",
          "val2": "10.77",
          "chgp": "-18.57%",
          "chgp_class": "positive"
        },
        {
          "field": "Exceptional Items",
          "val1": "-27.68",
          "val2": "0.00",
          "chgp": "",
          "chgp_class": "neutral"
        },
        {
          "field": "Consolidate Net Profit",
          "val1": "89.31",
          "val2": "111.43",
          "chgp": "-19.85%",
          "chgp_class": "negative"
        },
        {
          "field": "Operating Profit Margin (Excl OI)",
          "val1": "12.43%",
          "val2": "12.31%",
          "chgp": "0.12%",
          "chgp_class": "positive"
        }
      ]
    }
  }
]

Quarterly Results Snapshot (Consolidated) - Dec'25 - QoQstock-summary

Dec'25
Sep'25
Change(%)
Net Sales
409.25
378.34
8.17%
Operating Profit (PBDIT) excl Other Income
57.31
53.51
7.10%
Interest
4.84
3.05
58.69%
Exceptional Items
0.00
0.00
Consolidate Net Profit
33.60
36.44
-7.79%
Operating Profit Margin (Excl OI)
14.00%
14.14%
-0.14%
Values in Rs Cr.
Direction Arrows
Net Sales

QoQ Growth in quarter ended Dec 2025 is 8.17% vs 3.57% in Sep 2025

Direction Arrows
Consolidated Net Profit

QoQ Growth in quarter ended Dec 2025 is -7.79% vs -3.93% in Sep 2025

Half Yearly Results Snapshot (Consolidated) - Sep'25stock-summary

Sep'25
Sep'24
Change(%)
Net Sales
743.63
695.74
6.88%
Operating Profit (PBDIT) excl Other Income
108.94
97.01
12.30%
Interest
5.62
5.18
8.49%
Exceptional Items
0.00
0.00
Consolidate Net Profit
74.37
65.01
14.40%
Operating Profit Margin (Excl OI)
14.65%
13.94%
0.71%
Values in Rs Cr.
Direction Arrows
Net Sales

Growth in half year ended Sep 2025 is 6.88% vs 1.21% in Sep 2024

Direction Arrows
Consolidated Net Profit

Growth in half year ended Sep 2025 is 14.40% vs 44.56% in Sep 2024

Nine Monthly Results Snapshot (Consolidated) - Dec'25stock-summary

Dec'25
Dec'24
Change(%)
Net Sales
1,152.88
1,034.68
11.42%
Operating Profit (PBDIT) excl Other Income
166.25
139.78
18.94%
Interest
10.46
7.31
43.09%
Exceptional Items
0.00
0.00
Consolidate Net Profit
107.97
91.70
17.74%
Operating Profit Margin (Excl OI)
14.42%
13.51%
0.91%
Values in Rs Cr.
Direction Arrows
Net Sales

YoY Growth in nine months ended Dec 2025 is 11.42% vs 2.25% in Dec 2024

Direction Arrows
Consolidated Net Profit

YoY Growth in nine months ended Dec 2025 is 17.74% vs 22.84% in Dec 2024

Annual Results Snapshot (Consolidated) - Mar'25stock-summary

Mar'25
Mar'24
Change(%)
Net Sales
1,407.65
1,392.30
1.10%
Operating Profit (PBDIT) excl Other Income
174.94
171.35
2.10%
Interest
8.77
10.77
-18.57%
Exceptional Items
-27.68
0.00
Consolidate Net Profit
89.31
111.43
-19.85%
Operating Profit Margin (Excl OI)
12.43%
12.31%
0.12%
Values in Rs Cr.
Direction Arrows
Net Sales

YoY Growth in year ended Mar 2025 is 1.10% vs 2.07% in Mar 2024

Direction Arrows
Consolidated Net Profit

YoY Growth in year ended Mar 2025 is -19.85% vs -9.61% in Mar 2024

stock-summaryCompany CV
About Harsha Engineers International Ltd stock-summary
stock-summary
Harsha Engineers International Ltd
Small Cap
Other Industrial Products
Harsha Engineers International Limited was incorporated as a Private Limited Company dated December 11, 2010. Subsequently, Company's name was changed to Harsha Engineers International Private Limited pursuant to the Scheme approved by Hon'ble National Company Law Tribunal, Ahmedabad Bench vide order dated December 23, 2021 and a fresh Certificate of Incorporation consequent to name change was issued by the RoC on December 31, 2021.
Company Coordinates stock-summary
Icon
No Company Details Available