
Compare Haryana Capfin with Similar Stocks
Stock DNA
Non Banking Financial Company (NBFC)
INR 73 Cr (Micro Cap)
8.00
20
0.00%
0.07
3.32%
0.24
Total Returns (Price + Dividend) 
Haryana Capfin for the last several years.
Risk Adjusted Returns v/s
Returns Beta

News
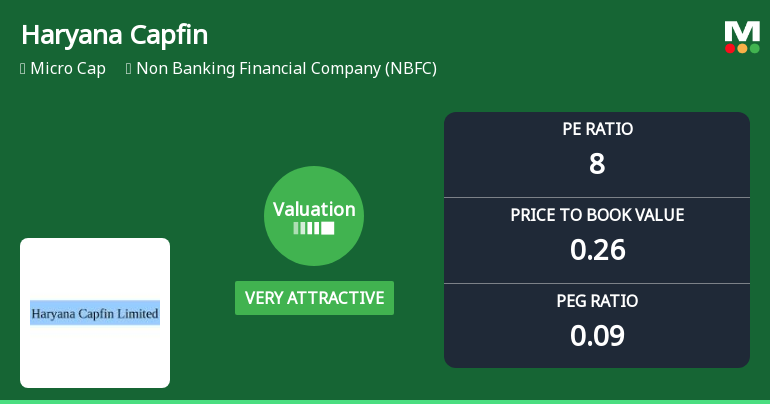
Haryana Capfin Ltd Valuation Shifts to Very Attractive Amid Mixed Returns
Haryana Capfin Ltd, a micro-cap player in the Non Banking Financial Company (NBFC) sector, has seen its valuation parameters improve significantly, shifting from attractive to very attractive territory. Despite a challenging recent performance relative to the Sensex, the stock’s low price-to-earnings and price-to-book ratios suggest a compelling entry point for value-focused investors.
Read full news article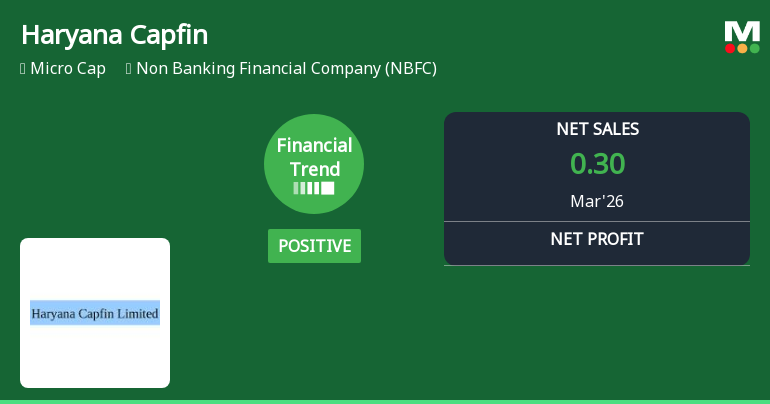
Haryana Capfin Ltd Reports Positive Financial Turnaround in Q4 FY26 Amid Mixed Market Returns
Haryana Capfin Ltd, a micro-cap player in the Non Banking Financial Company (NBFC) sector, has demonstrated a notable shift in its financial trajectory in the quarter ended March 2026. The company’s financial trend score improved significantly from -6 to 11 over the past three months, signalling a positive turnaround after a period of subdued performance.
Read full news articleAre Haryana Capfin Ltd latest results good or bad?
Haryana Capfin Ltd's latest financial results for Q4 FY26 present a complex picture. The company reported a net profit of ₹5.36 crores, which reflects a significant year-on-year increase. However, this profit is largely driven by a substantial reliance on non-operating income, which accounted for over 100% of profit before tax. This raises concerns about the sustainability of such earnings, as the core business operations showed a decline in net sales, falling to ₹0.30 crores, which is a 33.33% decrease year-on-year. The operating profit before depreciation, interest, and tax (excluding other income) was negligible, indicating a lack of operational profitability. The operating margin was recorded at 0.00%, a stark contrast to the previous year’s performance. Additionally, the return on equity (ROE) for the latest fiscal year stood at a low 1.53%, highlighting issues with capital efficiency compared to indu...
Read full news article Announcements
Announcement under Regulation 30 (LODR)-Newspaper Publication
30-May-2026 | Source : BSENewspapaper Publication of financial results for te quarter/year ended 31st March 2026
Board Meeting Outcome for Outcome Of Board Meeting
28-May-2026 | Source : BSEOutcome of Board Meeting
Financial Results
28-May-2026 | Source : BSEFinancial Results
Corporate Actions

No Upcoming Board Meetings

No Dividend history available

No Splits history available

No Bonus history available

No Rights history available
Quality key factors
Valuation key factors
Technicals key factors
 Technical Indicator Scale: Bearish, Mildly Bearish, Sideways, Mildly Bullish, Bullish Turned
 Shareholding Snapshot : Mar 2026
Shareholding Compare (%holding)
Promoters
None
Held by 0 Schemes
Held by 1 FIIs (0.81%)
Sudha Apparels Limited (19.47%)
Daniel Vyappar Private Limited (4.73%)
17.12%
Quarterly Results Snapshot (Standalone) - Mar'26 - QoQ

QoQ Growth in quarter ended Mar 2026 is 500.00% vs -99.17% in Dec 2025
QoQ Growth in quarter ended Mar 2026 is 9,033.33% vs -101.36% in Dec 2025
Half Yearly Results Snapshot (Standalone) - Sep'25

Growth in half year ended Sep 2025 is -4.56% vs 82.27% in Sep 2024
Growth in half year ended Sep 2025 is -5.11% vs 90.28% in Sep 2024
Nine Monthly Results Snapshot (Standalone) - Dec'25
YoY Growth in nine months ended Dec 2025 is -10.59% vs 76.12% in Dec 2024
YoY Growth in nine months ended Dec 2025 is -10.93% vs 82.96% in Dec 2024
Annual Results Snapshot (Standalone) - Mar'26
YoY Growth in year ended Mar 2026 is -14.48% vs 71.53% in Mar 2025
YoY Growth in year ended Mar 2026 is 86.97% vs 85.11% in Mar 2025
About Haryana Capfin Ltd

Company Coordinates


