
Compare Hathway Cable with Similar Stocks
Dashboard
Weak Long Term Fundamental Strength with a -34.06% CAGR growth in Operating Profits over the last 5 years
- Company's ability to service its debt is weak with a poor EBIT to Interest (avg) ratio of -5.92
- The company has been able to generate a Return on Equity (avg) of 2.30% signifying low profitability per unit of shareholders funds
Negative results in Mar 26
Despite the size of the company, domestic mutual funds hold only 0% of the company
Underperformed the market in the last 1 year
Stock DNA
Media & Entertainment
INR 1,839 Cr (Small Cap)
22.00
14
0.00%
-0.40
1.84%
0.40
Total Returns (Price + Dividend) 
Hathway Cable for the last several years.
Risk Adjusted Returns v/s
Returns Beta

News

Hathway Cable & Datacom Ltd is Rated Strong Sell
Hathway Cable & Datacom Ltd is rated Strong Sell by MarketsMOJO, with this rating last updated on 07 Jan 2026. However, the analysis and financial metrics discussed here reflect the company’s current position as of 20 May 2026, providing investors with the latest insights into its performance and outlook.
Read full news article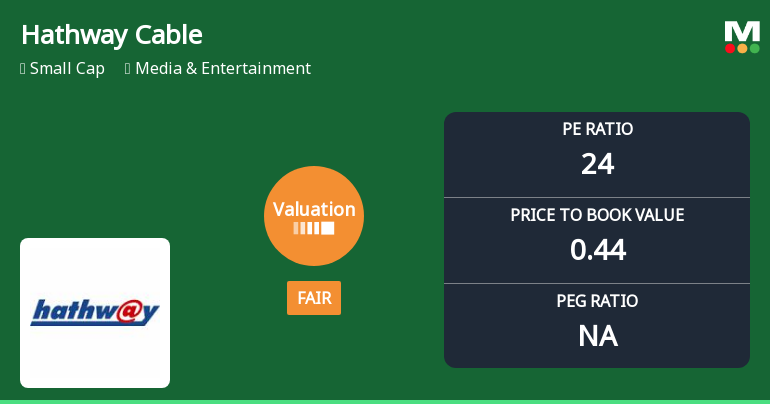
Hathway Cable & Datacom Ltd Valuation Shifts to Fair Amidst Continued Market Challenges
Hathway Cable & Datacom Ltd has witnessed a notable shift in its valuation parameters, moving from an expensive to a fair valuation grade. This change, coupled with its current price metrics and relative performance against the Sensex, offers investors a fresh perspective on the stock’s price attractiveness amid a challenging market backdrop.
Read full news article
Hathway Cable & Datacom Ltd is Rated Strong Sell
Hathway Cable & Datacom Ltd is rated Strong Sell by MarketsMOJO, with this rating last updated on 07 Jan 2026. However, the analysis and financial metrics discussed here reflect the stock’s current position as of 09 May 2026, providing investors with an up-to-date view of the company’s fundamentals, valuation, financial trend, and technical outlook.
Read full news article Announcements
Hathway Cable & Datacom Limited - Other General Purpose
14-Nov-2019 | Source : NSEHathway Cable & Datacom Limited has informed the Exchange regarding Disclosure of Related Party Transactions pursuant to Regulation 23(9) of SEBI (Listing Obligations and Disclosure Requirements) Regulations, 2015.
Hathway Cable & Datacom Limited - Outcome of Board Meeting
17-Oct-2019 | Source : NSEHathway Cable & Datacom Limited has informed the Exchange regarding Board meeting held on October 16, 2019.
Clarification
13-Sep-2019 | Source : NSE
| HATHWAY: The Exchange has sought clarification from Hathway Cable & Datacom Limited with respect to announcement dated 03-Sep-2019, regarding resignation of Mr A. Siddharth as Non- Executive Independent Director of the company w.e.f. September 03, 2019. On basis of above the Company is required to clarify following: 1.??Confirmation from the resigning director that there is no other material reasons other than provided.??The response of the Company is awaited. |
Corporate Actions

No Upcoming Board Meetings

No Dividend history available

Hathway Cable & Datacom Ltd has announced 2:10 stock split, ex-date: 06 Jan 15

No Bonus history available

No Rights history available
Quality key factors
Valuation key factors
Technicals key factors
 Technical Indicator Scale: Bearish, Mildly Bearish, Sideways, Mildly Bullish, Bullish Turned
 Shareholding Snapshot : Mar 2026
Shareholding Compare (%holding)
Promoters
None
Held by 1 Schemes (0.0%)
Held by 32 FIIs (0.64%)
Jio Content Distribution Holdings Private Limited (31.1%)
None
21.15%
Quarterly Results Snapshot (Consolidated) - Mar'26 - YoY

YoY Growth in quarter ended Mar 2026 is 6.37% vs 4.01% in Mar 2025

YoY Growth in quarter ended Mar 2026 is -67.33% vs 0.32% in Mar 2025
Half Yearly Results Snapshot (Consolidated) - Sep'25
Growth in half year ended Sep 2025 is 5.10% vs 3.29% in Sep 2024
Growth in half year ended Sep 2025 is 11.59% vs 4.10% in Sep 2024
Nine Monthly Results Snapshot (Consolidated) - Dec'25
YoY Growth in nine months ended Dec 2025 is 5.06% vs 2.61% in Dec 2024
YoY Growth in nine months ended Dec 2025 is 22.74% vs -10.70% in Dec 2024
Annual Results Snapshot (Consolidated) - Mar'26
YoY Growth in year ended Mar 2026 is 5.39% vs 2.96% in Mar 2025
YoY Growth in year ended Mar 2026 is -11.03% vs -6.85% in Mar 2025
About Hathway Cable & Datacom Ltd

Company Coordinates


