
Compare Hawa Engineers with Similar Stocks
Stock DNA
Industrial Manufacturing
INR 31 Cr (Micro Cap)
13.00
38
0.00%
0.22
10.13%
1.34
Total Returns (Price + Dividend) 
Hawa Engineers for the last several years.
Risk Adjusted Returns v/s
Returns Beta

News

Hawa Engineers Ltd Upgraded to Sell on Technical Improvements Despite Flat Financials
Hawa Engineers Ltd, a micro-cap player in the industrial manufacturing sector, has seen its investment rating upgraded from Strong Sell to Sell as of 15 June 2026. This change reflects a nuanced shift in the company’s technical outlook amid persistent challenges in financial performance and valuation metrics. The upgrade is primarily driven by improvements in technical indicators, while quality and financial trends remain mixed, prompting a cautious stance for investors.
Read full news article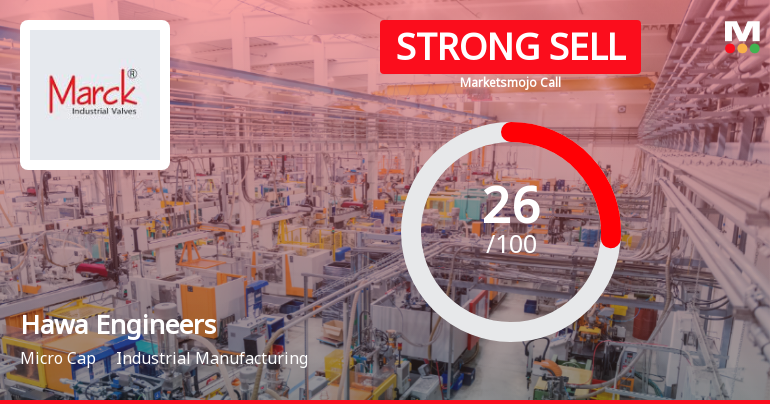
Hawa Engineers Ltd Downgraded to Strong Sell Amidst Flat Financials and Market Underperformance
Hawa Engineers Ltd, a micro-cap player in the industrial manufacturing sector, has been downgraded from a Sell to a Strong Sell rating as of 8 June 2026. This revision follows a combination of flat quarterly financial results, persistent underperformance against benchmarks, and deteriorating technical indicators, despite some positive valuation and management efficiency metrics.
Read full news article
Hawa Engineers Ltd is Rated Sell
Hawa Engineers Ltd is rated 'Sell' by MarketsMOJO, with this rating last updated on 07 Apr 2026. However, the analysis and financial metrics discussed here reflect the stock's current position as of 28 May 2026, providing investors with an up-to-date view of the company’s fundamentals, valuation, financial trends, and technical outlook.
Read full news article Announcements
Announcement Under Regulation 30
21-May-2026 | Source : BSEAppointment of Internal Auditor and Cost auditor of the company for the F.Y 2026-27
Board Meeting Outcome for Outcome Of The Board Meeting
21-May-2026 | Source : BSEThis is to inform you that the Meeting of Board of Directors of the Company was held on 21st May 2026 at Plot No. 129 Narol Road Near Kashiram Textile Mill Ahmedabad - 382405 and in that meeting of the Board of Directors amongst other matters the following businesses have approved. 1. Audited Standalone Financial Results of the Company for the quarter and financial year ended on 31st March 2026
Audited Standalone Financial Results Of The Company For The Quarter And Financial Year Ended On 31St March 2026.
21-May-2026 | Source : BSEAudited Standalone Financial Results of the company for the quarter and financial year ended on 31st March 2026.
Corporate Actions

No Upcoming Board Meetings

No Dividend history available

No Splits history available

No Bonus history available

No Rights history available
Quality key factors
Valuation key factors
Technicals key factors
 Technical Indicator Scale: Bearish, Mildly Bearish, Sideways, Mildly Bullish, Bullish Turned
 Shareholding Snapshot : Mar 2026
Shareholding Compare (%holding)
Promoters
None
Held by 0 Schemes
Held by 0 FIIs
Asad F Kagdi (7.56%)
Azhar M Rushnaiwala (1.54%)
40.85%
Quarterly Results Snapshot (Standalone) - Mar'26 - QoQ

QoQ Growth in quarter ended Mar 2026 is -16.78% vs -0.41% in Dec 2025
QoQ Growth in quarter ended Mar 2026 is -17.39% vs 30.19% in Dec 2025
Half Yearly Results Snapshot (Standalone) - Sep'25
Growth in half year ended Sep 2025 is -10.41% vs 17.44% in Sep 2024
Growth in half year ended Sep 2025 is -3.64% vs 139.13% in Sep 2024
Nine Monthly Results Snapshot (Standalone) - Dec'25
YoY Growth in nine months ended Dec 2025 is -1.26% vs 0.49% in Dec 2024

YoY Growth in nine months ended Dec 2025 is 36.72% vs -20.00% in Dec 2024
Annual Results Snapshot (Standalone) - Mar'26
YoY Growth in year ended Mar 2026 is -5.80% vs 1.19% in Mar 2025
YoY Growth in year ended Mar 2026 is 65.62% vs -11.11% in Mar 2025
About Hawa Engineers Ltd

Company Coordinates


