
Compare HB Stockholdings with Similar Stocks
Dashboard
With a Operating Losses, the company has a Weak Long Term Fundamental Strength
- Poor long term growth as Net Sales has grown by an annual rate of -1.60% and Operating profit at -199.50%
Negative results in Mar 26
Risky - Negative EBITDA
Below par performance in long term as well as near term
Stock DNA
Non Banking Financial Company (NBFC)
INR 35 Cr (Micro Cap)
NA (Loss Making)
21
2.04%
0.14
-13.78%
0.45
Total Returns (Price + Dividend) 
Latest dividend: 1 per share ex-dividend date: Jul-25-2025
Risk Adjusted Returns v/s
Returns Beta

News

HB Stockholdings Ltd is Rated Strong Sell
HB Stockholdings Ltd is rated Strong Sell by MarketsMOJO. This rating was last updated on 12 Nov 2025. However, the analysis and financial metrics discussed here reflect the stock’s current position as of 24 July 2026, providing investors with the latest insights into the company’s performance and outlook.
Read full news article
HB Stockholdings Ltd Locks at Lower Circuit With 4.61% Loss — Sellers Queue, No Buyers in Sight
At Rs 48.63, sellers were still queuing — but there were no buyers willing to take the other side. HB Stockholdings Ltd locked at its lower circuit of 4.61% on 7 Jul 2026, with unfilled sell orders and a frozen price, reflecting persistent selling pressure in a micro-cap stock with limited liquidity.
Read full news article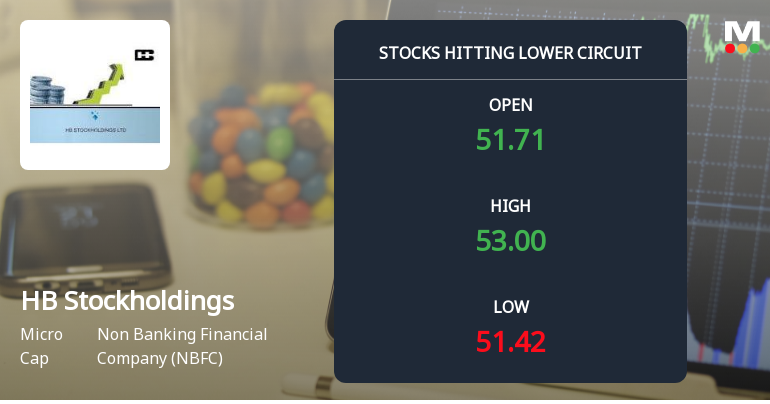
HB Stockholdings Ltd Locks at Lower Circuit With 1.42% Loss — Sellers Queue, No Buyers in Sight
At Rs 51.99, sellers were still queuing — but there were no buyers willing to take the other side. HB Stockholdings Ltd locked at its lower circuit of 5% on 3 Jul 2026, with unfilled sell orders and a frozen price.
Read full news article Announcements
HB Stockholdings Limited - Updates
09-Dec-2019 | Source : NSEHB Stockholdings Limited has informed the Exchange regarding 'Newspaper Publication of the Extract of Un-Audited Financial Results (Standalone & Consolidated) for the second quarter and half year ended 30th September, 2019 duly published by the Company in Business Standard (English & Hindi Edition) on Monday, 09th December, 2019'.
HB Stockholdings Limited - Reply to Clarification- Financial results
14-Nov-2019 | Source : NSEHB Stockholdings Limitedholdings Limited for the quarter ended 30-Jun-2019 with respect to Regulation 33 of the SEBI (Listing Obligations and Disclosure Requirements) Regulations, 2015.
HB Stockholdings Limited - Updates
31-Oct-2019 | Source : NSEHB Stockholdings Limited has informed the Exchange regarding 'Submission of Financial Results for the quarter and half year ended 30th September, 2019
Corporate Actions

No Upcoming Board Meetings

HB Stockholdings Ltd has declared 10% dividend, ex-date: 25 Jul 25

No Splits history available

No Bonus history available

No Rights history available
Quality key factors
Valuation key factors
Technicals key factors
 Technical Indicator Scale: Bearish, Mildly Bearish, Sideways, Mildly Bullish, Bullish Turned
 Shareholding Snapshot : Jun 2026
Shareholding Compare (%holding)
Promoters
None
Held by 1 Schemes (0.0%)
Held by 0 FIIs
Lalit Bhasin (51.54%)
None
35.39%
Quarterly Results Snapshot (Consolidated) - Mar'26 - QoQ

QoQ Growth in quarter ended Mar 2026 is -74.10% vs 239.02% in Dec 2025
QoQ Growth in quarter ended Mar 2026 is -165.78% vs 18.70% in Dec 2025
Half Yearly Results Snapshot (Consolidated) - Sep'25

Growth in half year ended Sep 2025 is -43.47% vs -48.76% in Sep 2024
Growth in half year ended Sep 2025 is -56.62% vs -67.87% in Sep 2024
Nine Monthly Results Snapshot (Consolidated) - Dec'25
YoY Growth in nine months ended Dec 2025 is -33.68% vs -68.03% in Dec 2024
YoY Growth in nine months ended Dec 2025 is 81.72% vs -114.67% in Dec 2024
Annual Results Snapshot (Consolidated) - Mar'26
YoY Growth in year ended Mar 2026 is 70.86% vs -96.60% in Mar 2025
YoY Growth in year ended Mar 2026 is 9.91% vs -131.99% in Mar 2025
About HB Stockholdings Ltd

Company Coordinates


