
Compare HBL Engineering with Similar Stocks
Dashboard
The company is Net-Debt Free
Healthy long term growth as Net Sales has grown by an annual rate of 29.35% and Operating profit at 106.13%
The company has declared Positive results for the last 4 consecutive quarters
With ROE of 37.9, it has a Very Expensive valuation with a 10.3 Price to Book Value
Despite the size of the company, domestic mutual funds hold only 0.92% of the company
Consistent Returns over the last 3 years
Stock DNA
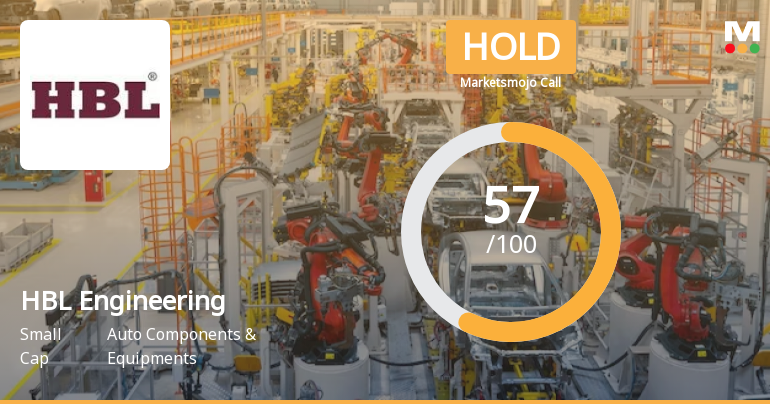
Auto Components & Equipments
INR 22,760 Cr (Small Cap)
27.00
29
0.37%
-0.28
37.86%
10.27
Total Returns (Price + Dividend) 
Latest dividend: 2 per share ex-dividend date: Feb-13-2026
Risk Adjusted Returns v/s
Returns Beta

News
HBL Engineering Ltd Upgraded to Hold as Technicals and Financials Improve
HBL Engineering Ltd, a small-cap player in the Auto Components & Equipments sector, has seen its investment rating upgraded from Sell to Hold as of 23 June 2026. This change reflects a combination of improved technical indicators, robust financial performance, and a more balanced valuation profile, signalling a cautious but positive outlook for investors.
Read full news article
HBL Engineering Ltd Technical Momentum Shifts Signal Mildly Bullish Outlook
HBL Engineering Ltd, a small-cap player in the Auto Components & Equipments sector, has experienced a notable shift in its technical momentum, moving from a sideways trend to a mildly bullish stance. This change is underscored by mixed signals from key technical indicators such as MACD, RSI, Bollinger Bands, and moving averages, reflecting a nuanced outlook for investors as the stock navigates current market conditions.
Read full news article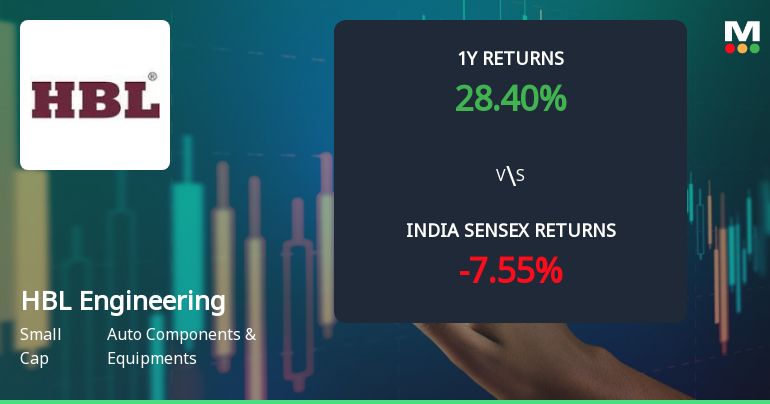
HBL Engineering Ltd Technical Momentum Shifts Amid Mixed Indicator Signals
HBL Engineering Ltd, a small-cap player in the Auto Components & Equipments sector, has experienced a notable shift in its technical momentum, reflecting a complex interplay of bullish and bearish signals across multiple timeframes. Despite a recent upgrade in price momentum from mildly bearish to sideways, the stock’s overall technical grade has been downgraded from Hold to Sell, underscoring caution for investors amid mixed indicator readings and a challenging market backdrop.
Read full news article Announcements
Statement Of Deviation Of Funds For March 31 2026
28-May-2026 | Source : BSEStatement of deviation of funds for the period ended March 31 2026.
Announcement under Regulation 30 (LODR)-Award_of_Order_Receipt_of_Order
28-May-2026 | Source : BSEHBL received letter of acceptance from Chittaranjan Locomotive Works for supply installation testing and commissioning of onboard Kavach loco equipment (ver 4.0) worth Rs.1714 Crs (excluding 18% GST). Contact to be completed in 12 months.
Information To The Shareholders
24-May-2026 | Source : BSEThe information is provided to shareholders because it is relevant for interpriting the result published on May 23 2026
Corporate Actions

No Upcoming Board Meetings

HBL Engineering Ltd has declared 200% dividend, ex-date: 13 Feb 26

HBL Engineering Ltd has announced 1:10 stock split, ex-date: 24 Nov 09

No Bonus history available

HBL Engineering Ltd has announced 1:10 rights issue, ex-date: 31 May 06
Quality key factors
Valuation key factors
Technicals key factors
 Technical Indicator Scale: Bearish, Mildly Bearish, Sideways, Mildly Bullish, Bullish Turned
 Shareholding Snapshot : Mar 2026
Shareholding Compare (%holding)
Promoters
None
Held by 19 Schemes (0.38%)
Held by 146 FIIs (5.94%)
Kavita Prasad Aluru - Trustee For Aluru Family Private Trust (51.3%)
None
29.01%
Quarterly Results Snapshot (Consolidated) - Mar'26 - QoQ

QoQ Growth in quarter ended Mar 2026 is -30.88% vs -28.53% in Dec 2025
QoQ Growth in quarter ended Mar 2026 is -71.10% vs -43.04% in Dec 2025
Half Yearly Results Snapshot (Consolidated) - Sep'25

Growth in half year ended Sep 2025 is 75.27% vs 1.67% in Sep 2024
Growth in half year ended Sep 2025 is 217.01% vs 39.00% in Sep 2024
Nine Monthly Results Snapshot (Consolidated) - Dec'25
YoY Growth in nine months ended Dec 2025 is 80.92% vs -8.11% in Dec 2024
YoY Growth in nine months ended Dec 2025 is 223.81% vs 16.31% in Dec 2024
Annual Results Snapshot (Consolidated) - Mar'26
YoY Growth in year ended Mar 2026 is 67.89% vs -11.92% in Mar 2025
YoY Growth in year ended Mar 2026 is 194.27% vs -1.41% in Mar 2025
About HBL Engineering Ltd

Company Coordinates


