HDFC Life Insur.

  • Market Cap: Large Cap
  • Industry: Insurance
  • ISIN: INE795G01014
  • NSEID: HDFCLIFE
  • BSEID: 540777
INR
563.55
11.4 (2.06%)
BSENSE

Sep 21, 02:46 PM

BSE+NSE Vol: 22.26 lacs

  • Price Points
  • Score
  • Mojo Parameters
  • Total Return
  • News and Corporate Actions
  • Key factors
  • Shareholding
  • Financials
  • CompanyCV
stock-summaryPrice Point
High/Low

1Day

52 Week

Valuation
Technical
Day's Volume

CASH

22.26 lacs (-50.25%) Volume

Shareholding (Jun 2026)

FII

19.27%

Held by 756 FIIs

DII

20.19%

Held by 132 DIIs

Promoter

50.54%

Why is HDFC Life Insurance Company Ltd falling/rising?

06-Sep-2026

As of 05-Sep, HDFC Life Insurance Company Ltd's stock price is rising to Rs 545.10, up 2.46% after a trend reversal and positive financial results. Despite a year-to-date decline of 27.28%, strong institutional support and attractive valuation metrics are boosting investor confidence.

As of 05-Sep, HDFC Life Insurance Company Ltd's stock price is rising, currently at Rs 545.10, reflecting an increase of Rs 13.1 or 2.46%. This upward movement can be attributed to several factors. Notably, the stock has experienced a trend reversal, gaining after four consecutive days of decline. Additionally, it outperformed its sector by 1.38% today and reached an intraday high of Rs 547.85, which is a 2.98% increase.<BR><BR>Despite the positive performance today, the stock has been underperforming in the long term, with a year-to-date decline of 27.28% and a one-year return of -27.70%. However, the recent declaration of positive results in June 2026, following two consecutive negative quarters, has likely contributed to the current rise. The company reported its highest operating cash flow and net sales, which may have boosted investor confidence.<BR><BR>Furthermore, the stock's valuation appears attractive with a return on equity (ROE) of 10.1 and a price-to-book value of 6.1, indicating that it is trading at a premium compared to its peers. High institutional holdings at 39.46% suggest that knowledgeable investors are backing the stock, which can also positively influence its price.<BR><BR>In summary, while HDFC Life Insurance Company Ltd has faced significant declines over the past year, today's price increase is driven by a combination of a trend reversal, positive financial results, and strong institutional support.

View full answer

Who are in the management team of HDFC Life Insur.?

01-Sep-2026

The management team of HDFC Life Insurance includes key members such as Deepak Parekh (Chairman), Vibha Padalkar (Managing Director & CEO), and Niraj Shah (CFO), along with several independent directors and other executives responsible for the company's operations and strategy.

The management team of HDFC Life Insurance includes the following key members:<BR><BR>1. **Deepak Parekh** - Chairman (Non-Executive)<BR>2. **Keki Mistry** - Director<BR>3. **VEGULAPARANAN KASI VISWANATHAN** - Independent Director<BR>4. **Prasad Chandran** - Independent Director<BR>5. **Sumit Bose** - Independent Director<BR>6. **Ketan Dalal** - Independent Director<BR>7. **Vibha Padalkar** - Managing Director & CEO<BR>8. **Narendra Gangan** - Company Secretary & Compliance Officer<BR>9. **Suresh Badami** - Deputy Managing Director<BR>10. **Bharti Gupta Ramola** - Independent Director<BR>11. **Bhaskar Ghosh** - Independent Director<BR>12. **Niraj Shah** - Whole Time Director & CFO<BR>13. **Kaizad Bharucha** - Non-Executive Director<BR><BR>This team is responsible for overseeing the operations and strategic direction of the company.

View full answer

What does HDFC Life Insur. do?

01-Sep-2026

HDFC Life Insurance Company Ltd, established in 2000, offers life insurance products and services, with a recent net sales of ₹33,759 Cr and a net profit of ₹611 Cr as of June 2026. It operates as a large-cap entity with a market capitalization of ₹118,080 Cr.

Overview: <BR>HDFC Life Insurance Company Ltd operates in the insurance industry as a large-cap entity, providing life insurance products and services.<BR><BR>History: <BR>The company was incorporated in Mumbai on August 14, 2000, and was formerly known as HDFC Standard Life Insurance Company Limited. It obtained the Certificate of Commencement of Business on October 12, 2000. The latest quarterly results reported net sales and net profit for June 2026.<BR><BR>Financial Snapshot: <BR>Most recent Net Sales: 33,759 Cr (Quarterly Results - Jun 2026) <BR>Most recent Net Profit: 611 Cr (Quarterly Results - Jun 2026) <BR>Market-cap value: INR 118,080 Cr (Large Cap)<BR><BR>Key Metrics: <BR>P/E: 60.00 <BR>Industry P/E: 21 <BR>Dividend Yield: 0.38% <BR>Debt Equity: 0.12 <BR>Return on Equity: 10.10% <BR>Price to Book: 6.08<BR><BR>Contact Details: <BR>Address: 13th Floor Lodha Excelus, ApolloMills Compound Mahalaxmi Mumbai Maharashtra : 400011 <BR>Tel: 91-22-67516666 <BR>Email: investor.service@hdfclife.com <BR>Website: http://www.hdfclife.com

View full answer

Who are the peers of the HDFC Life Insur.?

01-Sep-2026

HDFC Life Insurance's peers include SBI Life, ICICI Lombard, ICICI Prudential Life, Max Financial, and Niva Bupa Health, among others. HDFC Life has average management risk and a 1-year return of -29.51%, significantly lower than the highest peer return of 1.48% from New India Assurance.

Peers: The peers of HDFC Life Insur. are Life Insurance, SBI Life Insuran, ICICI Lombard, ICICI Pru Life, General Insuranc, Max Financial, Star Health Insu, New India Assura, Go Digit General, and Niva Bupa Health.<BR><BR>Quality Snapshot: Excellent management risk is observed at ICICI Lombard and Go Digit General, while Average management risk is found at HDFC Life Insur., SBI Life Insuran, ICICI Pru Life, Max Financial, Star Health Insu, and Niva Bupa Health, and the rest. Good management risk is noted at General Insuranc. Growth is Excellent at Niva Bupa Health, Good at SBI Life Insuran, Average at HDFC Life Insur., ICICI Lombard, General Insuranc, and the rest, and Below Average at Life Insurance, ICICI Pru Life, Max Financial, Star Health Insu, and New India Assura. All peers have an Excellent capital structure.<BR><BR>Return Snapshot: The peer with the highest 1-year return is New India Assura at 1.48%, while HDFC Life Insur. has the lowest at -29.51%. HDFC Life Insur.'s 1-year return is significantly lower than New India Assura's. Additionally, ICICI Lombard, ICICI Pru Life, Max Financial, Go Digit General, and Niva Bupa Health all have negative six-month returns.

View full answer

How big is HDFC Life Insur.?

01-Sep-2026

As of 31st August, HDFC Life Insurance Company Ltd has a market capitalization of 118,080.00 Cr, with net sales of 103726.83 Cr and a net profit of 1975.16 Cr over the latest four quarters.

As of 31st August, <BR><BR>Market Cap: HDFC Life Insurance Company Ltd has a market capitalization of 118,080.00 Cr and is classified as a Large Cap company.<BR><BR>Recent Quarterly Performance: The sum of Net Sales for the latest 4 quarters is 103726.83 Cr, while the sum of Net Profit for the same period is 1975.16 Cr.<BR><BR>Balance Sheet Snapshot: The reporting period for the latest annual data is March 2026. Shareholder's Funds stand at 17,749.54 Cr, and Total Assets amount to 3,90,500.09 Cr.

View full answer

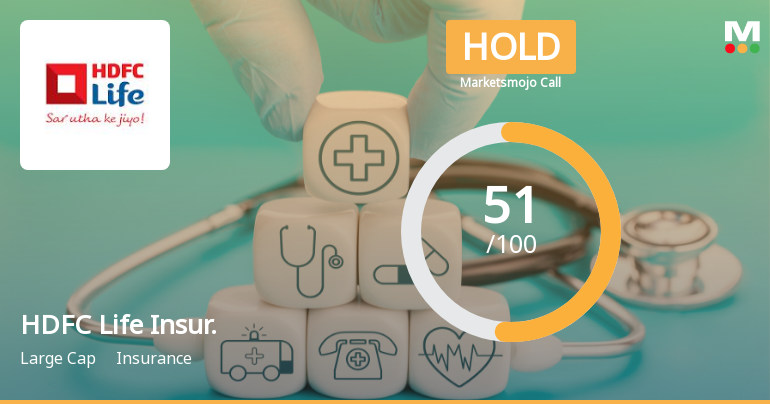
Should I buy, sell or hold HDFC Life Insurance Company Ltd?

01-Sep-2026

Are HDFC Life Insurance Company Ltd latest results good or bad?

16-Jul-2026

HDFC Life Insurance Company's latest results are strong, with a 69.73% increase in net sales and a 22.85% rise in net profit. However, concerns about high valuations and competitive pressures suggest that investors should proceed with caution.

HDFC Life Insurance Company Ltd's latest results can be characterized as good in terms of operational performance, but there are some caveats to consider regarding valuation and market conditions.<BR><BR>In the most recent quarter, the company reported a significant increase in net sales, which surged by 69.73% quarter-on-quarter to ₹33,758.51 crores, and a healthy year-on-year growth of 14.58%. Additionally, net profit reached ₹611.19 crores, reflecting a 22.85% increase from the previous quarter and an 11.46% rise year-on-year. The improvement in profitability metrics is noteworthy, with the profit after tax (PAT) margin expanding to 3.65%, up from 1.91% in the previous quarter.<BR><BR>However, despite these positive results, there are concerns regarding stretched valuations and a competitive market environment. The company's return on equity (ROE) stands at 10.77%, which, while showing some improvement, is still below that of several peers in the insurance sector. The elevated price-to-earnings (P/E) ratio of 64.41x indicates that the stock is trading at a premium compared to the sector average, which raises questions about the sustainability of such valuations.<BR><BR>Overall, while HDFC Life's operational performance is strong, the market's perception of its valuation and competitive pressures may temper the outlook. Investors should be cautious and consider these factors when evaluating the company's future prospects.

View full answer

When is the next results date for HDFC Life Insurance Company Ltd?

01-Jul-2026

The next results date for HDFC Life Insurance Company Ltd is 15 July 2026.

The next results date for HDFC Life Insurance Company Ltd is scheduled for 15 July 2026.

View full answer

Is HDFC Life Insur. overvalued or undervalued?

29-Nov-2025

As of November 28, 2025, HDFC Life Insurance is fairly valued with a PE ratio of 87.21 and has outperformed the Sensex with a year-to-date return of 24.1%, while its peers, Bajaj Finance and SBI Life Insurance, are rated as very expensive and very attractive, respectively.

As of 28 November 2025, HDFC Life Insurance has moved from an expensive to a fair valuation grade. The company is currently fairly valued, with a PE ratio of 87.21, an EV to EBITDA ratio of 105.66, and a ROE of 11.16%. In comparison to its peers, Bajaj Finance is rated as very expensive with a PE of 35.28, while SBI Life Insurance is considered very attractive with a PE of 80.42.<BR><BR>The valuation metrics indicate that HDFC Life Insurance is positioned reasonably within the industry, especially when compared to peers like Bajaj Finance and SBI Life Insurance. Despite its fair valuation, the company's recent stock performance has outpaced the Sensex, with a year-to-date return of 24.1% compared to the Sensex's 9.68%. This suggests a positive sentiment towards the stock, reinforcing its current valuation status.

View full answer

Is HDFC Life Insur. technically bullish or bearish?

18-Nov-2025

As of November 17, 2025, HDFC Life Insurance's trend is mildly bullish, supported by monthly indicators, though mixed signals from weekly metrics suggest a cautious outlook with potential volatility.

As of 17 November 2025, the technical trend for HDFC Life Insurance has changed from bullish to mildly bullish. The current stance is mildly bullish, supported by the monthly MACD and Bollinger Bands indicating bullish conditions, while the weekly MACD and KST show mildly bearish signals. The daily moving averages are bullish, but the weekly Dow Theory indicates no trend. The RSI shows no signal on both weekly and monthly time frames. Overall, the mixed signals suggest a cautious bullish outlook with potential for volatility.

View full answer

How has been the historical performance of HDFC Life Insur.?

15-Oct-2025

HDFC Life Insurance's historical performance shows fluctuating net sales, peaking at 1,01,481.80 Cr in March 2024 before declining to 96,921.74 Cr in March 2025. However, operating profit and profit after tax increased, with total assets growing to 3,49,411.58 Cr and cash flow from operations improving to 15,597.00 Cr in March 2025, indicating strong liquidity.

Answer:<BR>The historical performance of HDFC Life Insurance shows a fluctuating trend in net sales, with a peak of 1,01,481.80 Cr in March 2024, followed by a decrease to 96,921.74 Cr in March 2025. The total operating income mirrored this trend, reaching 1,01,481.80 Cr in March 2024 and then falling to 96,921.74 Cr in March 2025. Operating profit (PBDIT) saw a significant increase to 1,289.74 Cr in March 2025 from 977.28 Cr in March 2024, although it had previously peaked at 1,628.67 Cr in March 2021. Profit after tax also increased to 1,810.82 Cr in March 2025, up from 1,574.08 Cr in March 2024, indicating a positive trend in profitability. The company's total assets rose to 3,49,411.58 Cr in March 2025, compared to 3,02,686.94 Cr in March 2024, reflecting growth in the balance sheet. Cash flow from operating activities improved significantly to 15,597.00 Cr in March 2025, up from 10,721.00 Cr in March 2024, while cash flow from investing activities remained negative but stable at around -13,632.00 Cr. The company maintained a strong cash position, ending with 11,089.00 Cr in cash and cash equivalents in March 2025.<BR><BR>Breakdown:<BR>HDFC Life Insurance's financial performance has shown notable fluctuations over the years. Net sales peaked at 1,01,481.80 Cr in March 2024 before declining to 96,921.74 Cr in March 2025. Operating profit (PBDIT) increased to 1,289.74 Cr in March 2025, a recovery from the previous year's 977.28 Cr, while profit after tax also rose to 1,810.82 Cr in March 2025, up from 1,574.08 Cr in March 2024. The company's total assets grew significantly to 3,49,411.58 Cr in March 2025, reflecting a robust balance sheet, and cash flow from operating activities saw a substantial increase to 15,597.00 Cr, indicating improved operational efficiency. Despite consistent negative cash flow from investing activities, the company ended with a strong cash position of 11,089.00 Cr in March 2025, showcasing its liquidity strength.

View full answer

Who are the top shareholders of the HDFC Life Insur.?

17-Jul-2025

The top shareholders of HDFC Life Insurance are HDFC Bank Ltd. with 50.32%, foreign institutional investors holding 24.95%, and mutual funds with 11.32%. Exide Industries Ltd. is the largest public shareholder at 4.04%, while individual investors own 5.58%.

The top shareholders of HDFC Life Insurance include HDFC Bank Ltd., which holds the largest stake at 50.32%. Other significant shareholders are foreign institutional investors (FIIs), with a collective holding of 24.95%, and mutual funds, which are represented by 40 schemes holding 11.32%. Additionally, Exide Industries Ltd. is the highest public shareholder with a stake of 4.04%. Individual investors collectively hold 5.58% of the company.

View full answer

Has HDFC Life Insur. declared dividend?

06-Jun-2025

Yes, HDFC Life Insurance Company Ltd has declared a 21% dividend, amounting to ₹2 per share, with an ex-date of June 21, 2024. The company has demonstrated positive total returns across various periods, reflecting strong performance for investors.

HDFC Life Insurance Company Ltd has declared a 21% dividend.<BR><BR>Dividend Details:<BR>- Percentage announced: 21%<BR>- Amount per share: 2 per share<BR>- Ex-date: Jun-21-2024<BR><BR>Dividend Yield: 0.26%.<BR><BR>Total Returns by Period:<BR>In the last 6 months, the price return was 18.15%, the dividend return was 0.33%, resulting in a total return of 18.48%.<BR><BR>Over the past year, the price return reached 35.41%, with a dividend return of 0.72%, leading to a total return of 36.13%.<BR><BR>In the 2-year period, the price return was 29.85%, the dividend return was 0.65%, culminating in a total return of 30.5%.<BR><BR>For the 3-year period, the price return stood at 24.15%, the dividend return was 1.09%, resulting in a total return of 25.24%.<BR><BR>In the 4-year period, the price return was 10.51%, with a dividend return of 1.39%, leading to a total return of 11.9%.<BR><BR>Finally, over the last 5 years, the price return was 45.72%, the dividend return was 1.77%, resulting in a total return of 47.49%.<BR><BR>Overall, HDFC Life Insurance Company Ltd has shown a consistent dividend declaration and positive total returns across various periods, indicating a favorable performance for investors.

View full answer
iScoreScore
Click here to find our call on this stock
Strong Sell
Sell
Hold
Buy
Strong Buy

Dashboard

1

Company has a Debt to Equity ratio (avg) of 0.10 times

 
2

The company has declared positive results in Jun'2026 after 2 consecutive negative quarters

3

With ROE of 10.1, it has a Very Attractive valuation with a 6.1 Price to Book Value

4

High Institutional Holdings at 39.46%

5

Below par performance in long term as well as near term

stock-summaryMojo Parameters

Mojo Parameters

Loading Valuation Snapshot...

Stock DNA

stock-summary
Industry

Insurance

stock-summary
Market cap

INR 121,741 Cr (Large Cap)

stock-summary
P/E

61.00

stock-summary
Industry P/E

20

stock-summary
Dividend Yield

0.38%

stock-summary
Debt Equity

0.12

stock-summary
Return on Equity

10.10%

stock-summary
Price to Book

6.13

Revenue and Profits:
Net Sales:
33,759 Cr
(Quarterly Results - Jun 2026)
Net Profit:
611 Cr
stock-summaryTotal Returns
Total Returns (Price + Dividend) stock-summary
Dividend Yield (0.38%)
TimePeriod
Price Return
Dividend Return
Total Return
3 Months
-4.85%
0%
-4.85%
6 Months
-9.61%
0.34%
-9.27%
1 Year
-27.99%
0.27%
-27.72%
2 Years
-20.81%
0.59%
-20.22%
3 Years
-12.48%
1.01%
-11.47%
4 Years
2.21%
1.54%
3.75%
5 Years
-23.42%
1.39%
-22.03%

Latest dividend: 2.1 per share ex-dividend date: Jun-19-2026

Risk Adjusted Returns v/s stock-summary
Returns Beta
Icon
Beta has not been calculated since enough price history is not available
stock-summaryNews & Corporate Actions

News

P/E at 60.73 vs Industry's 20.24: What the Data Shows for HDFC Life Insurance Company Ltd

Significance of Nifty 50 Membership

Being part of the Nifty 50 index confers considerable advantages to HDFC Life Insurance Company Ltd. As one of the 50 largest and most liquid stocks on the National Stock Exchange, inclusion ensures heightened visibility among domestic and international institutional investors. This status often translates into increased trading volumes and greater analyst coverage, factors that can support share price stability and liquidity. Moreover, index funds and exchange-traded funds (ETFs) tracking the Nifty 50 are mandated to hold shares of HDFC Life, thereby creating a steady demand base.

However, membership also subjects the stock to the broader index’s performance dynamics and investor sentim...

Read full news article

HDFC Life Gains 4.18%: 5 Key Factors Driving the Week’s Momentum

Announcements stock-summary

Disclosure Under Regulation 30 Of SEBI (Listing Obligations And Disclosure Requirements) Regulations 2015 - GST Order

11-Sep-2026 | Source : BSE

Please refer the file for further details.

Analyst / Investor Meet - Intimation

31-Aug-2026 | Source : BSE

Please refer the attached file for further details.

Announcement under Regulation 30 (LODR)-Allotment of ESOP / ESPS

26-Aug-2026 | Source : BSE

Allotment of 114000 equity shares under ESOP Schemes.

Corporate Actions stock-summary

stock-summary
BOARD MEETING

No Upcoming Board Meetings

stock-summary
DIVIDEND

HDFC Life Insurance Company Ltd has declared 21% dividend, ex-date: 19 Jun 26

stock-summary
SPLITS

No Splits history available

stock-summary
BONUS

No Bonus history available

stock-summary
RIGHTS

No Rights history available

stock-summaryKey Factors

Quality key factors stock-summary

Factor
Value
Sales Growth (5y)
7.66%
EBIT Growth (5y)
5.77%
EBIT to Interest (avg)
100.00
Debt to EBITDA (avg)
2.44
Net Debt to Equity (avg)
0.12
Sales to Capital Employed (avg)
5.44
Tax Ratio
5.54%
Dividend Payout Ratio
23.70%
Pledged Shares
0
Institutional Holding
39.46%
ROCE (avg)
5.04%
ROE (avg)
10.23%

Valuation key factors

Factor
Value
P/E Ratio
61
Industry P/E
20
Price to Book Value
6.13
EV to EBIT
101.92
EV to EBITDA
101.92
EV to Capital Employed
5.59
EV to Sales
1.18
PEG Ratio
14.51
Dividend Yield
0.38%
ROCE (Latest)
5.48%
ROE (Latest)
10.10%

Technicals key factors

Indicator
Weekly
Monthly
MACD
Mildly Bullish
Bearish
RSI
Bearish
No Signal
Bollinger Bands
Mildly Bearish
Mildly Bearish
Moving Averages
Mildly Bearish (Daily)
KST
Mildly Bullish
Bearish
Dow Theory
Mildly Bullish
Mildly Bearish
OBV
Mildly Bullish
Mildly Bullish
stock-summary Technical Indicator Scale: Bearish, Mildly Bearish, Sideways, Mildly Bullish, Bullish  Turned 
stock-summaryShareholding
Shareholding Snapshot : Jun 2026stock-summary
Shareholding Compare (%holding) stock-summary
Majority shareholders

Promoters

Pledged Promoter Holdings

None

Mutual Funds

Held by 47 Schemes (16.57%)

FIIs

Held by 756 FIIs (19.27%)

Promoter with highest holding

Hdfc Bank Limited (50.54%)

Highest Public shareholder

Icici Prudential Mutual Fund (4.48%)

Individual Investors Holdings

5.01%

stock-summaryFinancial
[
  {
    "link": "quarterly",
    "btn_text": "All Quarterly Results",
    "header": "Quarterly Results Snapshot (Consolidated) - Jun'26 - YoY",
    "rhs": [
      {
        "prefix": "Net Sales ",
        "suffix": "YoY Growth in quarter ended Jun 2026 is 14.58% vs 9.39% in Jun 2025",
        "dir": 1
      },
      {
        "prefix": "Consolidated Net Profit ",
        "suffix": "YoY Growth in quarter ended Jun 2026 is 11.46% vs 14.49% in Jun 2025",
        "dir": -1
      }
    ],
    "table": {
      "header": [
        "Jun'26",
        "Jun'25",
        "Change(%)"
      ],
      "body": [
        {
          "field": "Net Sales",
          "val1": "33,758.51",
          "val2": "29,463.18",
          "chgp": "14.58%",
          "chgp_class": "positive"
        },
        {
          "field": "Operating Profit (PBDIT) excl Other Income",
          "val1": "505.81",
          "val2": "439.32",
          "chgp": "15.13%",
          "chgp_class": "positive"
        },
        {
          "field": "Interest",
          "val1": "0.00",
          "val2": "0.00",
          "chgp": "",
          "chgp_class": "neutral"
        },
        {
          "field": "Exceptional Items",
          "val1": "0.00",
          "val2": "0.00",
          "chgp": "",
          "chgp_class": "neutral"
        },
        {
          "field": "Consolidate Net Profit",
          "val1": "611.19",
          "val2": "548.35",
          "chgp": "11.46%",
          "chgp_class": "positive"
        },
        {
          "field": "Operating Profit Margin (Excl OI)",
          "val1": "3.02%",
          "val2": "3.02%",
          "chgp": "NA",
          "chgp_class": "neutral"
        }
      ]
    }
  },
  {
    "link": "half-yearly",
    "btn_text": "All Half Yearly Results",
    "header": "Half Yearly Results Snapshot (Consolidated) - Sep'25",
    "rhs": [
      {
        "prefix": "Net Sales ",
        "suffix": " Growth in half year ended Sep 2025 is -9.59% vs 19.17% in Sep 2024",
        "dir": -1
      },
      {
        "prefix": "Consolidated Net Profit ",
        "suffix": " Growth in half year ended Sep 2025 is 9.02% vs 15.00% in Sep 2024",
        "dir": -1
      }
    ],
    "table": {
      "header": [
        "Sep'25",
        "Sep'24",
        "Change(%)"
      ],
      "body": [
        {
          "field": "Net Sales",
          "val1": "50,113.86",
          "val2": "55,430.82",
          "chgp": "-9.59%",
          "chgp_class": "negative"
        },
        {
          "field": "Operating Profit (PBDIT) excl Other Income",
          "val1": "753.98",
          "val2": "1.48",
          "chgp": "50,844.59%",
          "chgp_class": "positive"
        },
        {
          "field": "Interest",
          "val1": "0.00",
          "val2": "0.00",
          "chgp": "",
          "chgp_class": "neutral"
        },
        {
          "field": "Exceptional Items",
          "val1": "0.00",
          "val2": "0.00",
          "chgp": "",
          "chgp_class": "neutral"
        },
        {
          "field": "Consolidate Net Profit",
          "val1": "996.64",
          "val2": "914.15",
          "chgp": "9.02%",
          "chgp_class": "positive"
        },
        {
          "field": "Operating Profit Margin (Excl OI)",
          "val1": "2.26%",
          "val2": "0.01%",
          "chgp": "2.25%",
          "chgp_class": "positive"
        }
      ]
    }
  },
  {
    "link": "nine-monthly",
    "btn_text": "All Nine Monthly Results",
    "header": "Nine Monthly Results Snapshot (Consolidated) - Dec'25",
    "rhs": [
      {
        "prefix": "Net Sales ",
        "suffix": "YoY Growth in nine months ended Dec 2025 is 9.36% vs -0.97% in Dec 2024",
        "dir": 1
      },
      {
        "prefix": "Consolidated Net Profit ",
        "suffix": "YoY Growth in nine months ended Dec 2025 is 5.94% vs 14.88% in Dec 2024",
        "dir": -1
      }
    ],
    "table": {
      "header": [
        "Dec'25",
        "Dec'24",
        "Change(%)"
      ],
      "body": [
        {
          "field": "Net Sales",
          "val1": "79,541.47",
          "val2": "72,731.09",
          "chgp": "9.36%",
          "chgp_class": "positive"
        },
        {
          "field": "Operating Profit (PBDIT) excl Other Income",
          "val1": "1,024.76",
          "val2": "449.51",
          "chgp": "127.97%",
          "chgp_class": "positive"
        },
        {
          "field": "Interest",
          "val1": "0.00",
          "val2": "0.00",
          "chgp": "",
          "chgp_class": "neutral"
        },
        {
          "field": "Exceptional Items",
          "val1": "0.00",
          "val2": "0.00",
          "chgp": "",
          "chgp_class": "neutral"
        },
        {
          "field": "Consolidate Net Profit",
          "val1": "1,414.83",
          "val2": "1,335.46",
          "chgp": "5.94%",
          "chgp_class": "positive"
        },
        {
          "field": "Operating Profit Margin (Excl OI)",
          "val1": "1.29%",
          "val2": "0.62%",
          "chgp": "0.67%",
          "chgp_class": "positive"
        }
      ]
    }
  },
  {
    "link": "annual",
    "btn_text": "All Annual Results",
    "header": "Annual Results Snapshot (Consolidated) - Mar'26",
    "rhs": [
      {
        "prefix": "Net Sales ",
        "suffix": "YoY Growth in year ended Mar 2026 is 2.59% vs -4.49% in Mar 2025",
        "dir": 1
      },
      {
        "prefix": "Consolidated Net Profit ",
        "suffix": "YoY Growth in year ended Mar 2026 is 5.61% vs 15.04% in Mar 2025",
        "dir": -1
      }
    ],
    "table": {
      "header": [
        "Mar'26",
        "Mar'25",
        "Change(%)"
      ],
      "body": [
        {
          "field": "Net Sales",
          "val1": "99,431.50",
          "val2": "96,921.74",
          "chgp": "2.59%",
          "chgp_class": "positive"
        },
        {
          "field": "Operating Profit (PBDIT) excl Other Income",
          "val1": "1,133.26",
          "val2": "826.38",
          "chgp": "37.14%",
          "chgp_class": "positive"
        },
        {
          "field": "Interest",
          "val1": "0.00",
          "val2": "0.00",
          "chgp": "",
          "chgp_class": "neutral"
        },
        {
          "field": "Exceptional Items",
          "val1": "0.00",
          "val2": "0.00",
          "chgp": "",
          "chgp_class": "neutral"
        },
        {
          "field": "Consolidate Net Profit",
          "val1": "1,912.32",
          "val2": "1,810.82",
          "chgp": "5.61%",
          "chgp_class": "positive"
        },
        {
          "field": "Operating Profit Margin (Excl OI)",
          "val1": "1.46%",
          "val2": "1.18%",
          "chgp": "0.28%",
          "chgp_class": "positive"
        }
      ]
    }
  }
]

Quarterly Results Snapshot (Consolidated) - Jun'26 - YoYstock-summary

Jun'26
Jun'25
Change(%)
Net Sales
33,758.51
29,463.18
14.58%
Operating Profit (PBDIT) excl Other Income
505.81
439.32
15.13%
Interest
0.00
0.00
Exceptional Items
0.00
0.00
Consolidate Net Profit
611.19
548.35
11.46%
Operating Profit Margin (Excl OI)
3.02%
3.02%
NA
Values in Rs Cr.
Direction Arrows
Net Sales

YoY Growth in quarter ended Jun 2026 is 14.58% vs 9.39% in Jun 2025

Direction Arrows
Consolidated Net Profit

YoY Growth in quarter ended Jun 2026 is 11.46% vs 14.49% in Jun 2025

Half Yearly Results Snapshot (Consolidated) - Sep'25stock-summary

Sep'25
Sep'24
Change(%)
Net Sales
50,113.86
55,430.82
-9.59%
Operating Profit (PBDIT) excl Other Income
753.98
1.48
50,844.59%
Interest
0.00
0.00
Exceptional Items
0.00
0.00
Consolidate Net Profit
996.64
914.15
9.02%
Operating Profit Margin (Excl OI)
2.26%
0.01%
2.25%
Values in Rs Cr.
Direction Arrows
Net Sales

Growth in half year ended Sep 2025 is -9.59% vs 19.17% in Sep 2024

Direction Arrows
Consolidated Net Profit

Growth in half year ended Sep 2025 is 9.02% vs 15.00% in Sep 2024

Nine Monthly Results Snapshot (Consolidated) - Dec'25stock-summary

Dec'25
Dec'24
Change(%)
Net Sales
79,541.47
72,731.09
9.36%
Operating Profit (PBDIT) excl Other Income
1,024.76
449.51
127.97%
Interest
0.00
0.00
Exceptional Items
0.00
0.00
Consolidate Net Profit
1,414.83
1,335.46
5.94%
Operating Profit Margin (Excl OI)
1.29%
0.62%
0.67%
Values in Rs Cr.
Direction Arrows
Net Sales

YoY Growth in nine months ended Dec 2025 is 9.36% vs -0.97% in Dec 2024

Direction Arrows
Consolidated Net Profit

YoY Growth in nine months ended Dec 2025 is 5.94% vs 14.88% in Dec 2024

Annual Results Snapshot (Consolidated) - Mar'26stock-summary

Mar'26
Mar'25
Change(%)
Net Sales
99,431.50
96,921.74
2.59%
Operating Profit (PBDIT) excl Other Income
1,133.26
826.38
37.14%
Interest
0.00
0.00
Exceptional Items
0.00
0.00
Consolidate Net Profit
1,912.32
1,810.82
5.61%
Operating Profit Margin (Excl OI)
1.46%
1.18%
0.28%
Values in Rs Cr.
Direction Arrows
Net Sales

YoY Growth in year ended Mar 2026 is 2.59% vs -4.49% in Mar 2025

Direction Arrows
Consolidated Net Profit

YoY Growth in year ended Mar 2026 is 5.61% vs 15.04% in Mar 2025

stock-summaryCompany CV
About HDFC Life Insurance Company Ltd stock-summary
stock-summary
HDFC Life Insurance Company Ltd
Large Cap
Insurance
HDFC Life Insurance Company Limited (formerly known as HDFC Standard Life Insurance Company Limited) is formed as a Joint Venture between Housing Development Finance Corporation Limited (HDFC Limited) and Abrdn plc, formerly Standard Life Aberdeen plc. and was incorporated in Mumbai on 14th August, 2000. The Company obtained the Certificate of Commencement of Business on October 12, 2000.
Company Coordinates stock-summary
Company Details
13th Floor Lodha Excelus, ApolloMills Compound Mahalaxmi Mumbai Maharashtra : 400011
stock-summary
Tel: 91-22-67516666
stock-summary
investor.service@hdfclife.com
Registrar Details
Karvy Computershare Pvt Ltd., Karvy Selenium, Tower-B Plot No 31 & 32, Survey No 116/22, 115/24, 115/25, Financial District, Nanakramguda, Serilingampally, Mandal Ranga Reddy Dist, Hyderabad