
 Price Point
Compare Health.Global with Similar Stocks
ScoreDashboard
Company's ability to service its debt is weak with a poor EBIT to Interest (avg) ratio of 1.19
- Company's ability to service its debt is weak with a poor EBIT to Interest (avg) ratio of 1.19
- The company has been able to generate a Return on Equity (avg) of 3.63% signifying low profitability per unit of shareholders funds
Healthy long term growth as Operating profit has grown by an annual rate 54.46%
With a growth in Operating Profit of 19.15%, the company declared Very Positive results in Mar 26
With ROCE of 8.8, it has a Attractive valuation with a 4.4 Enterprise value to Capital Employed
High Institutional Holdings at 21.94%


 Total Returns
Total Returns (Price + Dividend) 
Health.Global for the last several years.
Risk Adjusted Returns v/s
Returns Beta
 News & Corporate Actions
News
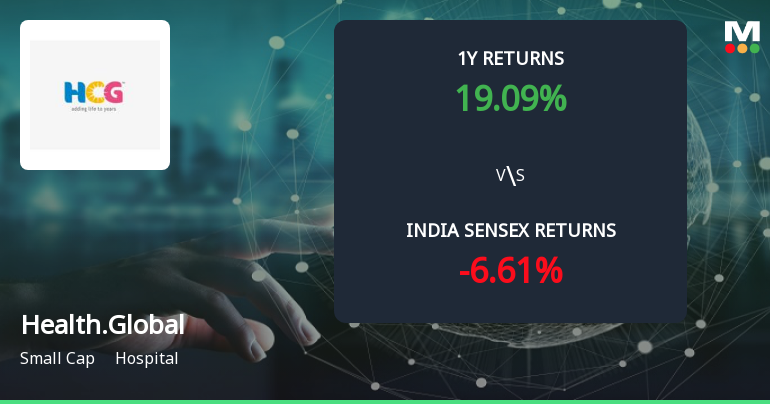
Golden Cross Confirmed: Do Healthcare Global Enterprises Ltd's Other Technical Indicators Agree?
The 50-day moving average has crossed above the 200-day moving average for Healthcare Global Enterprises Ltd, signalling a golden cross on 22 Jul 2026. Yet, the broader technical landscape presents a nuanced picture, with weekly indicators largely supportive but monthly momentum showing mild bearishness. This divergence invites a closer examination of the signal's reliability.
Read full news article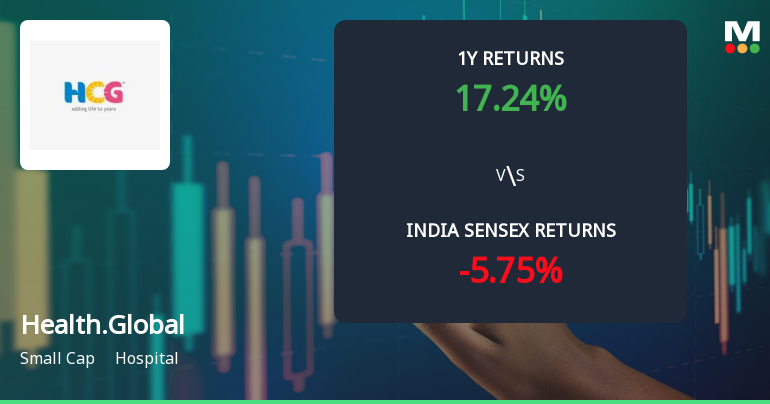
Healthcare Global Enterprises Ltd Technical Momentum Shifts to Mildly Bullish
Healthcare Global Enterprises Ltd, a small-cap player in the hospital sector, has experienced a subtle shift in price momentum, moving from a sideways trend to a mildly bullish stance. Despite mixed signals from key technical indicators, the stock’s recent performance and comparative returns against the Sensex suggest cautious optimism among investors.
Read full news article
Healthcare Global Enterprises Ltd Downgraded to Hold Amid Mixed Technical and Financial Signals
Healthcare Global Enterprises Ltd, a small-cap player in the hospital sector, has seen its investment rating downgraded from Buy to Hold as of 20 July 2026. This adjustment reflects a nuanced reassessment across four key parameters: quality, valuation, financial trend, and technicals. While the company continues to demonstrate strong long-term growth and healthy financial metrics, evolving market dynamics and technical indicators have prompted a more cautious stance.
Read full news article Announcements
Shareholder Meeting / Postal Ballot-Scrutinizers Report
09-Jul-2026 | Source : BSEScrutinizers report and Outcome of the Postal Ballot for the agenda(s) listed in the Postal Ballot Notice dated June 08 2026 of the Company.
Compliances-Certificate under Reg. 74 (5) of SEBI (DP) Regulations 2018
03-Jul-2026 | Source : BSECertificate under Regulation 74(5) of SEBI (Depositories and Participants) Regulations 2018 for the quarter ended June 30 2026.
Closure of Trading Window
30-Jun-2026 | Source : BSEIntimation for closure of Trading Window under the SEBI (Prohibition of Insider Trading) Regulations 2015 for the quarter ending June 30 2026.
Corporate Actions

No Upcoming Board Meetings

No Dividend history available

No Splits history available

No Bonus history available

Healthcare Global Enterprises Ltd has announced 1:17 rights issue, ex-date: 02 Mar 26
Key FactorsQuality key factors
Valuation key factors
Technicals key factors
 Technical Indicator Scale: Bearish, Mildly Bearish, Sideways, Mildly Bullish, Bullish Turned Shareholding
Shareholding Snapshot : Jun 2026
Shareholding Compare (%holding)
Promoters
5.1734
Held by 11 Schemes (15.43%)
Held by 80 FIIs (2.74%)
Hector Asia Holdings Ii Pte. Ltd. (54.27%)
Nippon Life India Trustee Ltd-a/c Nippon India Sma (5.6%)
10.83%
FinancialQuarterly Results Snapshot (Consolidated) - Mar'26 - YoY
 Compare with Peers
YoY Growth in quarter ended Mar 2026 is 11.48% vs 18.30% in Mar 2025
YoY Growth in quarter ended Mar 2026 is -70.52% vs -65.38% in Mar 2025

Half Yearly Results Snapshot (Consolidated) - Sep'25

Growth in half year ended Sep 2025 is 16.76% vs 13.88% in Sep 2024
Growth in half year ended Sep 2025 is -30.10% vs 41.97% in Sep 2024
Nine Monthly Results Snapshot (Consolidated) - Dec'25
YoY Growth in nine months ended Dec 2025 is 15.59% vs 15.53% in Dec 2024
YoY Growth in nine months ended Dec 2025 is -68.72% vs 37.83% in Dec 2024
Annual Results Snapshot (Consolidated) - Mar'26
YoY Growth in year ended Mar 2026 is 14.51% vs 16.25% in Mar 2025
YoY Growth in year ended Mar 2026 is -69.02% vs -7.75% in Mar 2025
 Company CV
About Healthcare Global Enterprises Ltd

Company Coordinates










