Health.Global

INR
654.90
1.15 (0.18%)
BSENSE

May 25

BSE+NSE Vol: 5.36 lacs

  • Price Points
  • Score
  • Mojo Parameters
  • Total Return
  • News and Corporate Actions
  • Key factors
  • Shareholding
  • Financials
  • CompanyCV
stock-summaryPrice Point
High/Low

1Day

52 Week

Valuation
Technical
Day's Volume

CASH

5.36 lacs (45.20%) Volume

Shareholding (Mar 2026)

FII

2.71%

Held by 82 FIIs

DII

18.89%

Held by 22 DIIs

Promoter

64.21%

how big is Health.Global?

06-Jun-2025

As of October 2023, Healthcare Global Enterprises Ltd has a market capitalization of 7,641.00 Cr and reported net sales of 2,222.85 Cr and net profit of 44.41 Cr over the latest four quarters. Shareholder's funds are 825.78 Cr, with total assets of 2,700.44 Cr as of March 2024.

Market Cap: Healthcare Global Enterprises Ltd has a market capitalization of 7,641.00 Cr, categorizing it as a Mid Cap company.<BR><BR>Recent Quarterly Performance: The sum of Net Sales for the latest 4 quarters, which includes data from Mar'25, Dec'24, Sep'24, and Jun'24, is 2,222.85 Cr. The sum of Net Profit for the same period is 44.41 Cr. This data is Consolidated.<BR><BR>Balance Sheet Snapshot: This is Consolidated data for the latest annual period ending in Mar'24. The Shareholder's Funds amount to 825.78 Cr, and the Total Assets are valued at 2,700.44 Cr.

View full answer

What does Health.Global do?

06-Jun-2025

HealthCare Global Enterprises Ltd operates in the hospital industry, focusing on oncology services. As of March 2025, it reported net sales of 585 Cr and a net profit of 7 Cr, with a market cap of Rs 7,701 Cr.

Overview: <BR>Healthcare Global Enterprises Ltd operates in the hospital industry and is categorized as a mid-cap company.<BR><BR>History: <BR>The company was originally incorporated as Curie Centre of Oncology Private Limited in 1998. It changed its name to HealthCare Global Enterprises Private Limited in 2005 and became a public limited company, adopting its current name in 2006. The latest quarterly results reported net sales and profit for March 2025.<BR><BR>Financial Snapshot: <BR>Most recent Net Sales: 585 Cr (Quarterly Results - Mar 2025) <BR>Most recent Net Profit: 7 Cr (Quarterly Results - Mar 2025) <BR>Market-cap value: Rs 7,701 Cr (Mid Cap)<BR><BR>Key Metrics: <BR>P/E: 172.00 <BR>Industry P/E: 54 <BR>Dividend Yield: 0.00% <BR>Debt-Equity: 1.61 <BR>Return on Equity: 4.81% <BR>Price to Book: 8.30 <BR><BR>Contact Details: <BR>Address: HCG Tower No 8 Kalinga Rao Rd, Sampangi Rama Nagar Bangalore Karnataka : 560027 <BR>Tel: 91-80-4660-7700 <BR>Email: sunumanuel@hcgoncology.com <BR>Website: http://www.hcgel.com

View full answer

Who are in the management team of Health.Global?

06-Jun-2025

As of March 2023, the management team of Health.Global includes Chairman/CEO Basavalinga Ajai Kumar Sadashivaiah, Executive Director Anjali Ajaikumar Rossi, and several independent and non-executive directors, overseeing the company's strategic direction and governance.

As of March 2023, the management team of Health.Global includes the following individuals:<BR><BR>1. BASAVALINGA AJAIKUMAR SADASHIVAIAH - Chairman/ED & CEO<BR>2. Siddharth Patel - Non Executive Director / Nomin<BR>3. Anjali Ajaikumar Rossi - Executive Director<BR>4. Geet Mathur - Independent Non Executive Director<BR>5. RAJAGOPALAN RAGHAVAN - Independent Non Executive Director<BR>6. Pradip M. Kanakia - Independent Non Executive Director<BR>7. Meghraj Arvindrao Gore - Whole Time Director & CEO<BR>8. AMIT SONI - Non Executive Director / Nomin<BR>9. Rajiv Maliwal - Independent Non Executive Director<BR>10. SUNU MANUEL - Company Secretary & Compliance Officer<BR><BR>This team is responsible for the strategic direction and governance of the company.

View full answer

When is the next results date for Health.Global?

06-Jun-2025

No Upcoming Board Meetings

Has Health.Global declared dividend?

06-Jun-2025

No Dividend History Available

Who are the peers of the Health.Global?

03-Jun-2025

Health.Global's peers include Max Healthcare, Apollo Hospitals, Fortis Health, Narayana Hrudaya, Global Health, Kovai Medical, Yatharth Hospital, Indraprastha Medical, and Artemis Medicare. Key metrics show varying management risks, growth rates, and capital structures, with Indraprastha Medical leading in 1-year returns at 78.47% and Global Health at the lowest with 4.29%.

Peers: The peers of Health.Global are Max Healthcare, Apollo Hospitals, Fortis Health., Narayana Hrudaya, Global Health, Kovai Medical, Yatharth Hospit., Indrapr.Medical, Artemis Medicare.<BR><BR>Quality Snapshot: Excellent management risk is observed at Max Healthcare, Apollo Hospitals, Narayana Hrudaya, Global Health, Kovai Medical, and Indrapr.Medical, while Average management risk is found at Fortis Health., Yatharth Hospit., and Artemis Medicare, and the rest have Below Average management risk. Excellent growth is seen at Max Healthcare and Apollo Hospitals, while Good growth is noted at Fortis Health., Narayana Hrudaya, Health.Global, Yatharth Hospit., and Indrapr.Medical, with Average growth at Global Health and Below Average growth at Kovai Medical and Artemis Medicare. Excellent capital structure is present at Max Healthcare, Global Health, and Indrapr.Medical, while Good capital structure is found at Fortis Health., Narayana Hrudaya, Kovai Medical, and Yatharth Hospit., and the rest have Average or Below Average capital structure.<BR><BR>Return Snapshot: The peer with the highest 1-year return is Indrapr.Medical at 78.47%, while the lowest is Global Health at 4.29%. Health.Global's 1-year return of 54.56% is higher than Global Health's but lower than Indrapr.Medical's. Additionally, peers with negative six-month returns include Yatharth Hospit. and Artemis Medicare.

View full answer

Who are the top shareholders of the Health.Global?

17-Jul-2025

The top shareholders of Health.Global include Aceso Company Pte. Ltd. with 60.35%, followed by mutual funds at 9.19%, individual investors at 10.43%, and foreign institutional investors at 2.45%. The largest public shareholder is Tata India Pharma & Healthcare Fund, owning 3.42%.

The top shareholders of Health.Global include Aceso Company Pte. Ltd., which holds the largest stake at 60.35%. The promoters are the majority shareholders, with a pledged promoter holding of 4.995%. Additionally, mutual funds hold 9.19% of the shares across 9 schemes, while foreign institutional investors (FIIs) have a combined holding of 2.45% through 85 different entities. The highest public shareholder is Tata India Pharma & Healthcare Fund, which owns 3.42%. Individual investors collectively hold 10.43% of the company's shares.

View full answer

How has been the historical performance of Health.Global?

24-Nov-2025

Health.Global has shown strong growth in net sales, reaching 2,222.85 Cr in March 2025, with operating profit increasing to 387.28 Cr and a margin of 17.46%. However, profit before tax declined to 56.19 Cr, and the company faces cash management challenges despite improved operating cash flow.

Answer:<BR>The historical performance of Health.Global shows a significant upward trend in net sales and operating profit over the past several years, culminating in a net sales figure of 2,222.85 Cr for the year ending March 2025, up from 1,912.12 Cr in March 2024 and 1,694.44 Cr in March 2023. The total operating income has also increased consistently, reaching 2,222.85 Cr in March 2025. Operating profit, excluding other income, rose to 387.28 Cr in March 2025 from 329.59 Cr in March 2024, reflecting a healthy operating profit margin of 17.46%. However, profit before tax decreased to 56.19 Cr in March 2025 from 67.33 Cr in March 2024, leading to a profit after tax of 48.06 Cr, slightly up from 40.93 Cr the previous year. <BR><BR>In terms of assets and liabilities, total assets increased to 3,518.24 Cr in March 2025 from 2,700.44 Cr in March 2024, while total liabilities also rose to 3,518.24 Cr, indicating a balanced growth. The company’s total debt increased to 1,002.23 Cr in March 2025 from 672.76 Cr in March 2024. Cash flow from operating activities improved to 317.00 Cr in March 2025, although the net cash outflow was recorded at -213.00 Cr, indicating challenges in cash management. Overall, Health.Global has shown growth in sales and operating profit, but faces pressures on profitability and cash flow management.<BR><BR>Breakdown:<BR>Health.Global has demonstrated a robust growth trajectory in net sales, which reached 2,222.85 Cr in March 2025, marking a significant increase from 1,912.12 Cr in March 2024 and 1,694.44 Cr in March 2023. The total operating income mirrored this growth, also hitting 2,222.85 Cr in March 2025. Operating profit, excluding other income, rose to 387.28 Cr, up from 329.59 Cr the previous year, resulting in an operating profit margin of 17.46%. Despite this positive trend, profit before tax saw a decline to 56.19 Cr in March 2025 from 67.33 Cr in March 2024, leading to a profit after tax of 48.06 Cr, which is an increase from 40.93 Cr in the prior year. <BR><BR>On the balance sheet, total assets surged to 3,518.24 Cr in March 2025, compared to 2,700.44 Cr in March 2024, while total liabilities matched this figure, indicating a balanced growth. The total debt increased to 1,002.23 Cr in March 2025 from 672.76 Cr in March 2024. Cash flow from operating activities improved to 317.00 Cr, yet the company faced a net cash outflow of -213.00 Cr, highlighting ongoing challenges in cash management despite the growth in sales and operating profit.

View full answer

Is Health.Global overvalued or undervalued?

25-Nov-2025

As of November 24, 2025, Health.Global is considered undervalued with an attractive valuation grade, despite having a high PE ratio of 286.73 and an EV to EBITDA ratio of 27.53, while outperforming the Sensex with a 53.86% return over the past year.

As of 24 November 2025, Health.Global's valuation grade has moved from fair to attractive, indicating a more favorable assessment of its market position. The company is currently considered undervalued, especially when compared to its peers. Key ratios include a PE ratio of 286.73, an EV to EBITDA ratio of 27.53, and a ROCE of 7.64%. <BR><BR>In the peer comparison, Health.Global's PE ratio significantly exceeds that of Apollo Hospitals, which stands at 63.22, while its EV to EBITDA ratio is also higher than Apollo's 33.25. This suggests that Health.Global may be overvalued on a relative basis despite its attractive grade. Notably, the company's stock has outperformed the Sensex over the past year, returning 53.86% compared to the Sensex's 7.31%, reinforcing the notion of its strong market performance despite the high valuation ratios.

View full answer

Is Health.Global technically bullish or bearish?

04-Dec-2025

As of December 3, 2025, the trend is mildly bullish due to positive daily moving averages and Bollinger Bands, but caution is advised due to mixed signals from the MACD, KST, and monthly RSI.

As of 3 December 2025, the technical trend has changed from bullish to mildly bullish. The current stance is mildly bullish, driven by the daily moving averages indicating bullishness and the Bollinger Bands showing a mildly bullish signal on both weekly and monthly time frames. However, the MACD and KST on the weekly are mildly bearish, and the monthly RSI is bearish, suggesting some caution. Overall, the mixed signals indicate a mildly bullish outlook with underlying weaknesses that could affect momentum.

View full answer

Are Healthcare Global Enterprises Ltd latest results good or bad?

21-May-2026

Healthcare Global Enterprises Ltd's latest results are concerning, showing a 70.52% decline in net profit despite an 11.48% increase in net sales. The company's financial challenges, including high interest costs and low return on equity, overshadow its revenue growth.

Healthcare Global Enterprises Ltd's latest results present a mixed picture, leaning towards the negative side. In the fourth quarter of FY26, the company reported consolidated net profit of ₹2.17 crores, which is a significant decline of 70.52% year-on-year. This sharp drop in profitability raises concerns about the company's ability to convert its revenue growth into actual earnings.<BR><BR>On the positive side, net sales reached ₹652.33 crores, reflecting an 11.48% increase year-on-year, which indicates strong revenue generation capabilities. Additionally, the operating margin improved to 19.23%, suggesting better operational efficiency.<BR><BR>However, the stark contrast between rising revenues and plummeting profits highlights serious underlying issues. High interest costs and depreciation, along with a very low return on equity of 3.84%, indicate that the company is struggling to manage its capital effectively. Furthermore, the stock has underperformed compared to its peers in the hospital sector, which raises further concerns about its market position and valuation.<BR><BR>Overall, while there are some positive aspects in terms of revenue growth and operational margins, the significant decline in net profit and the company's financial challenges suggest that the latest results are more concerning than encouraging.

View full answer

Should I buy, sell or hold Healthcare Global Enterprises Ltd?

21-May-2026

Why is Healthcare Global Enterprises Ltd falling/rising?

25-May-2026

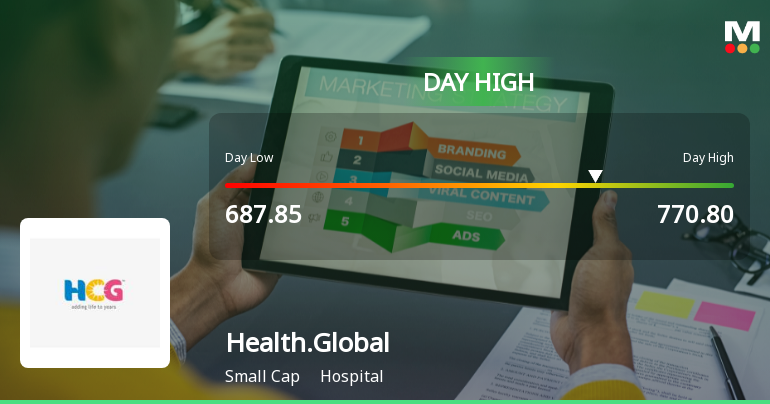
As of 24-May, Healthcare Global Enterprises Ltd's stock price is rising to 653.75, up 4.27%, driven by strong investor interest, positive financial results, and solid performance metrics. The stock is trading above key moving averages and has outperformed its sector, indicating robust momentum and confidence among investors.

As of 24-May, Healthcare Global Enterprises Ltd's stock price is rising, currently at 653.75, reflecting an increase of 26.75 or 4.27%. This upward movement can be attributed to several positive factors. The stock has outperformed the sector by 5% today and reached an intraday high of Rs 660.85, which is a 5.4% increase. Additionally, the stock is trading above its 5-day, 20-day, 50-day, 100-day, and 200-day moving averages, indicating strong momentum.<BR><BR>Investor participation has also surged, with a delivery volume of 4.74 lacs on 21 May, which is a significant increase of 262.46% compared to the 5-day average. This heightened interest suggests growing confidence among investors. Furthermore, the company has demonstrated healthy long-term growth, with an annual operating profit growth rate of 54.46%. The recent positive financial results, including a 19.15% increase in operating profit and a record net sales figure of Rs 652.33 crore, further bolster investor sentiment.<BR><BR>The stock's attractive valuation, trading at a discount compared to its peers, along with high institutional holdings at 21.61%, indicates strong backing from knowledgeable investors. Overall, the combination of positive performance metrics, increased investor activity, and solid financial results contributes to the rising stock price of Healthcare Global Enterprises Ltd.

View full answer
iScoreScore
Click here to find our call on this stock
Strong Sell
Sell
Hold
Buy
Strong Buy

Dashboard

1

Company's ability to service its debt is weak with a poor EBIT to Interest (avg) ratio of 1.19

  • Company's ability to service its debt is weak with a poor EBIT to Interest (avg) ratio of 1.19
  • The company has been able to generate a Return on Equity (avg) of 3.63% signifying low profitability per unit of shareholders funds
2

Healthy long term growth as Operating profit has grown by an annual rate 54.46%

 
3

With a growth in Operating Profit of 19.15%, the company declared Very Positive results in Mar 26

4

With ROCE of 8.8, it has a Attractive valuation with a 4.3 Enterprise value to Capital Employed

5

High Institutional Holdings at 21.61%

stock-summaryMojo Parameters

Mojo Parameters

Loading Valuation Snapshot...

Stock DNA

stock-summary
Industry

Hospital

stock-summary
Market cap

INR 9,867 Cr (Small Cap)

stock-summary
P/E

168.00

stock-summary
Industry P/E

102

stock-summary
Dividend Yield

0.00%

stock-summary
Debt Equity

0.90

stock-summary
Return on Equity

4.38%

stock-summary
Price to Book

7.34

Revenue and Profits:
Net Sales:
652 Cr
(Quarterly Results - Mar 2026)
Net Profit:
2 Cr
stock-summaryTotal Returns
Total Returns (Price + Dividend) stock-summary
Dividend Yield (0%)
TimePeriod
Price Return
Dividend Return
Total Return
3 Months
13.37%
0%
13.37%
6 Months
-9.4%
0%
-9.4%
1 Year
10.09%
0%
10.09%
2 Years
81.51%
0%
81.51%
3 Years
115.96%
0%
115.96%
4 Years
139.82%
0%
139.82%
5 Years
237.92%
0%
237.92%

Health.Global for the last several years.

Risk Adjusted Returns v/s stock-summary
Returns Beta
Icon
Beta has not been calculated since enough price history is not available
stock-summaryNews & Corporate Actions

News

Healthcare Global Enterprises Ltd Gains 2.24%: 2 Key Factors Driving the Week

Key Events This Week

18 May: Stock opens at Rs.632.35, down 1.10% amid broader market weakness

19 May: Price rebounds sharply, gaining 2.27% to Rs.646.70

20 May: Strong quarterly results announced; stock closes at Rs.651.80 (+0.79%)

21 May: Profit concerns weigh; stock falls 3.80% to Rs.627.00

22 May: Recovery rally lifts stock 4.27% to Rs.653.75

Announcements stock-summary

Announcement under Regulation 30 (LODR)-Newspaper Publication

21-May-2026 | Source : BSE

Newspaper advertisement of Audited Financial Results (Standalone and Consolidated) of the Company for the quarter and year ended March 31 2026 approved at the meeting of Board of Directors held on May 19 2026.

Announcement under Regulation 30 (LODR)-Analyst / Investor Meet - Outcome

20-May-2026 | Source : BSE

Further to our intimation dated May 07 2026 we would like to inform you that the Audio recording of the Earnings Call with Analysts/Investors held on May 20 2026 to discuss the Audited Financial Results (Standalone and Consolidated) of the Company for the quarter and year ended March 31 2026 is made available on the website of the Company.

Compliances-Reg.24(A)-Annual Secretarial Compliance

20-May-2026 | Source : BSE

Pursuant to Listing Regulations please find enclosed herewith the Annual Secretarial Compliance Report of the Company for the financial year ended March 31 2026 issued by M/s V Sreedharan and Associates Practicing Company Secretaries Secretarial Auditors of the Company.

Corporate Actions stock-summary

stock-summary
BOARD MEETING

No Upcoming Board Meetings

stock-summary
DIVIDEND

No Dividend history available

stock-summary
SPLITS

No Splits history available

stock-summary
BONUS

No Bonus history available

stock-summary
RIGHTS

Healthcare Global Enterprises Ltd has announced 1:17 rights issue, ex-date: 02 Mar 26

stock-summaryKey Factors

Quality key factors stock-summary

Factor
Value
Sales Growth (5y)
20.22%
EBIT Growth (5y)
54.46%
EBIT to Interest (avg)
1.19
Debt to EBITDA (avg)
3.88
Net Debt to Equity (avg)
0.90
Sales to Capital Employed (avg)
0.86
Tax Ratio
15.38%
Dividend Payout Ratio
0
Pledged Shares
5.17%
Institutional Holding
21.61%
ROCE (avg)
7.16%
ROE (avg)
3.63%

Valuation key factors

Factor
Value
P/E Ratio
168
Industry P/E
102
Price to Book Value
7.34
EV to EBIT
49.52
EV to EBITDA
23.56
EV to Capital Employed
4.34
EV to Sales
4.31
PEG Ratio
7.39
Dividend Yield
NA
ROCE (Latest)
8.77%
ROE (Latest)
4.38%

Technicals key factors

Indicator
Weekly
Monthly
MACD
Mildly Bullish
Mildly Bearish
RSI
No Signal
No Signal
Bollinger Bands
Bullish
Bullish
Moving Averages
Mildly Bearish (Daily)
KST
Mildly Bullish
Mildly Bearish
Dow Theory
Mildly Bullish
Mildly Bearish
OBV
Mildly Bullish
Mildly Bearish
stock-summary Technical Indicator Scale: Bearish, Mildly Bearish, Sideways, Mildly Bullish, Bullish  Turned 
stock-summaryShareholding
Shareholding Snapshot : Mar 2026stock-summary
Shareholding Compare (%holding) stock-summary
Majority shareholders

Promoters

Pledged Promoter Holdings

5.1734

Mutual Funds

Held by 11 Schemes (15.31%)

FIIs

Held by 82 FIIs (2.71%)

Promoter with highest holding

Hector Asia Holdings Ii Pte. Ltd. (54.27%)

Highest Public shareholder

Nippon Life India Trustee Ltd-a/c Nippon India Sma (5.6%)

Individual Investors Holdings

10.89%

stock-summaryFinancial
[
  {
    "link": "quarterly",
    "btn_text": "All Quarterly Results",
    "header": "Quarterly Results Snapshot (Consolidated) - Mar'26 - YoY",
    "rhs": [
      {
        "prefix": "Net Sales ",
        "suffix": "YoY Growth in quarter ended Mar 2026 is 11.48% vs 18.30% in Mar 2025",
        "dir": -1
      },
      {
        "prefix": "Consolidated Net Profit ",
        "suffix": "YoY Growth in quarter ended Mar 2026 is -70.52% vs -65.38% in Mar 2025",
        "dir": -1
      }
    ],
    "table": {
      "header": [
        "Mar'26",
        "Mar'25",
        "Change(%)"
      ],
      "body": [
        {
          "field": "Net Sales",
          "val1": "652.33",
          "val2": "585.16",
          "chgp": "11.48%",
          "chgp_class": "positive"
        },
        {
          "field": "Operating Profit (PBDIT) excl Other Income",
          "val1": "125.08",
          "val2": "105.72",
          "chgp": "18.31%",
          "chgp_class": "positive"
        },
        {
          "field": "Interest",
          "val1": "42.70",
          "val2": "44.17",
          "chgp": "-3.33%",
          "chgp_class": "positive"
        },
        {
          "field": "Exceptional Items",
          "val1": "-31.91",
          "val2": "0.00",
          "chgp": "",
          "chgp_class": "neutral"
        },
        {
          "field": "Consolidate Net Profit",
          "val1": "2.17",
          "val2": "7.36",
          "chgp": "-70.52%",
          "chgp_class": "negative"
        },
        {
          "field": "Operating Profit Margin (Excl OI)",
          "val1": "19.23%",
          "val2": "18.12%",
          "chgp": "1.11%",
          "chgp_class": "positive"
        }
      ]
    }
  },
  {
    "link": "half-yearly",
    "btn_text": "All Half Yearly Results",
    "header": "Half Yearly Results Snapshot (Consolidated) - Sep'25",
    "rhs": [
      {
        "prefix": "Net Sales ",
        "suffix": " Growth in half year ended Sep 2025 is 16.76% vs 13.88% in Sep 2024",
        "dir": 1
      },
      {
        "prefix": "Consolidated Net Profit ",
        "suffix": " Growth in half year ended Sep 2025 is -30.10% vs 41.97% in Sep 2024",
        "dir": -1
      }
    ],
    "table": {
      "header": [
        "Sep'25",
        "Sep'24",
        "Change(%)"
      ],
      "body": [
        {
          "field": "Net Sales",
          "val1": "1,260.01",
          "val2": "1,079.12",
          "chgp": "16.76%",
          "chgp_class": "positive"
        },
        {
          "field": "Operating Profit (PBDIT) excl Other Income",
          "val1": "231.10",
          "val2": "193.18",
          "chgp": "19.63%",
          "chgp_class": "positive"
        },
        {
          "field": "Interest",
          "val1": "89.09",
          "val2": "69.69",
          "chgp": "27.84%",
          "chgp_class": "negative"
        },
        {
          "field": "Exceptional Items",
          "val1": "0.00",
          "val2": "0.00",
          "chgp": "",
          "chgp_class": "neutral"
        },
        {
          "field": "Consolidate Net Profit",
          "val1": "21.02",
          "val2": "30.07",
          "chgp": "-30.10%",
          "chgp_class": "negative"
        },
        {
          "field": "Operating Profit Margin (Excl OI)",
          "val1": "18.39%",
          "val2": "17.93%",
          "chgp": "0.46%",
          "chgp_class": "positive"
        }
      ]
    }
  },
  {
    "link": "nine-monthly",
    "btn_text": "All Nine Monthly Results",
    "header": "Nine Monthly Results Snapshot (Consolidated) - Dec'25",
    "rhs": [
      {
        "prefix": "Net Sales ",
        "suffix": "YoY Growth in nine months ended Dec 2025 is 15.59% vs 15.53% in Dec 2024",
        "dir": 1
      },
      {
        "prefix": "Consolidated Net Profit ",
        "suffix": "YoY Growth in nine months ended Dec 2025 is -68.72% vs 37.83% in Dec 2024",
        "dir": -1
      }
    ],
    "table": {
      "header": [
        "Dec'25",
        "Dec'24",
        "Change(%)"
      ],
      "body": [
        {
          "field": "Net Sales",
          "val1": "1,893.08",
          "val2": "1,637.69",
          "chgp": "15.59%",
          "chgp_class": "positive"
        },
        {
          "field": "Operating Profit (PBDIT) excl Other Income",
          "val1": "340.71",
          "val2": "281.56",
          "chgp": "21.01%",
          "chgp_class": "positive"
        },
        {
          "field": "Interest",
          "val1": "133.87",
          "val2": "110.39",
          "chgp": "21.27%",
          "chgp_class": "negative"
        },
        {
          "field": "Exceptional Items",
          "val1": "-12.67",
          "val2": "0.00",
          "chgp": "",
          "chgp_class": "neutral"
        },
        {
          "field": "Consolidate Net Profit",
          "val1": "11.59",
          "val2": "37.05",
          "chgp": "-68.72%",
          "chgp_class": "negative"
        },
        {
          "field": "Operating Profit Margin (Excl OI)",
          "val1": "18.00%",
          "val2": "17.19%",
          "chgp": "0.81%",
          "chgp_class": "positive"
        }
      ]
    }
  },
  {
    "link": "annual",
    "btn_text": "All Annual Results",
    "header": "Annual Results Snapshot (Consolidated) - Mar'26",
    "rhs": [
      {
        "prefix": "Net Sales ",
        "suffix": "YoY Growth in year ended Mar 2026 is 14.51% vs 16.25% in Mar 2025",
        "dir": -1
      },
      {
        "prefix": "Consolidated Net Profit ",
        "suffix": "YoY Growth in year ended Mar 2026 is -69.02% vs -7.75% in Mar 2025",
        "dir": -1
      }
    ],
    "table": {
      "header": [
        "Mar'26",
        "Mar'25",
        "Change(%)"
      ],
      "body": [
        {
          "field": "Net Sales",
          "val1": "2,545.41",
          "val2": "2,222.85",
          "chgp": "14.51%",
          "chgp_class": "positive"
        },
        {
          "field": "Operating Profit (PBDIT) excl Other Income",
          "val1": "465.79",
          "val2": "387.28",
          "chgp": "20.27%",
          "chgp_class": "positive"
        },
        {
          "field": "Interest",
          "val1": "176.57",
          "val2": "154.56",
          "chgp": "14.24%",
          "chgp_class": "negative"
        },
        {
          "field": "Exceptional Items",
          "val1": "-44.58",
          "val2": "0.00",
          "chgp": "",
          "chgp_class": "neutral"
        },
        {
          "field": "Consolidate Net Profit",
          "val1": "13.76",
          "val2": "44.41",
          "chgp": "-69.02%",
          "chgp_class": "negative"
        },
        {
          "field": "Operating Profit Margin (Excl OI)",
          "val1": "18.35%",
          "val2": "17.46%",
          "chgp": "0.89%",
          "chgp_class": "positive"
        }
      ]
    }
  }
]

Quarterly Results Snapshot (Consolidated) - Mar'26 - YoYstock-summary

Mar'26
Mar'25
Change(%)
Net Sales
652.33
585.16
11.48%
Operating Profit (PBDIT) excl Other Income
125.08
105.72
18.31%
Interest
42.70
44.17
-3.33%
Exceptional Items
-31.91
0.00
Consolidate Net Profit
2.17
7.36
-70.52%
Operating Profit Margin (Excl OI)
19.23%
18.12%
1.11%
Values in Rs Cr.
Direction Arrows
Net Sales

YoY Growth in quarter ended Mar 2026 is 11.48% vs 18.30% in Mar 2025

Direction Arrows
Consolidated Net Profit

YoY Growth in quarter ended Mar 2026 is -70.52% vs -65.38% in Mar 2025

Half Yearly Results Snapshot (Consolidated) - Sep'25stock-summary

Sep'25
Sep'24
Change(%)
Net Sales
1,260.01
1,079.12
16.76%
Operating Profit (PBDIT) excl Other Income
231.10
193.18
19.63%
Interest
89.09
69.69
27.84%
Exceptional Items
0.00
0.00
Consolidate Net Profit
21.02
30.07
-30.10%
Operating Profit Margin (Excl OI)
18.39%
17.93%
0.46%
Values in Rs Cr.
Direction Arrows
Net Sales

Growth in half year ended Sep 2025 is 16.76% vs 13.88% in Sep 2024

Direction Arrows
Consolidated Net Profit

Growth in half year ended Sep 2025 is -30.10% vs 41.97% in Sep 2024

Nine Monthly Results Snapshot (Consolidated) - Dec'25stock-summary

Dec'25
Dec'24
Change(%)
Net Sales
1,893.08
1,637.69
15.59%
Operating Profit (PBDIT) excl Other Income
340.71
281.56
21.01%
Interest
133.87
110.39
21.27%
Exceptional Items
-12.67
0.00
Consolidate Net Profit
11.59
37.05
-68.72%
Operating Profit Margin (Excl OI)
18.00%
17.19%
0.81%
Values in Rs Cr.
Direction Arrows
Net Sales

YoY Growth in nine months ended Dec 2025 is 15.59% vs 15.53% in Dec 2024

Direction Arrows
Consolidated Net Profit

YoY Growth in nine months ended Dec 2025 is -68.72% vs 37.83% in Dec 2024

Annual Results Snapshot (Consolidated) - Mar'26stock-summary

Mar'26
Mar'25
Change(%)
Net Sales
2,545.41
2,222.85
14.51%
Operating Profit (PBDIT) excl Other Income
465.79
387.28
20.27%
Interest
176.57
154.56
14.24%
Exceptional Items
-44.58
0.00
Consolidate Net Profit
13.76
44.41
-69.02%
Operating Profit Margin (Excl OI)
18.35%
17.46%
0.89%
Values in Rs Cr.
Direction Arrows
Net Sales

YoY Growth in year ended Mar 2026 is 14.51% vs 16.25% in Mar 2025

Direction Arrows
Consolidated Net Profit

YoY Growth in year ended Mar 2026 is -69.02% vs -7.75% in Mar 2025

stock-summaryCompany CV
About Healthcare Global Enterprises Ltd stock-summary
stock-summary
Healthcare Global Enterprises Ltd
Small Cap
Hospital
Healthcare Global Enterprises Limited was originally incorporated as Curie Centre of Oncology Private Limited on March 12, 1998 at Bengaluru, Karnataka, India as a Private Limited Company. The name of the Company was changed to HealthCare Global Enterprises Private Limited on November 14, 2005. Thereafter, it was converted into a Public Limited Company and the name of the Company was changed to Healthcare Global Enterprises Limited on July 5, 2006.
Company Coordinates stock-summary
Company Details
HCG Tower No 8 Kalinga Rao Rd, Sampangi Rama Nagar Bangalore Karnataka : 560027
stock-summary
Tel: 91-80-4660-7700
stock-summary
sunumanuel@hcgoncology.com
Registrar Details
Karvy Computershare Pvt Ltd., Karvy Selenium, Tower-B Plot No 31 & 32, Survey No 116/22, 115/24, 115/25, Financial District, Nanakramguda, Serilingampally, Mandal Ranga Reddy Dist, Hyderabad