
Compare Hercules Investm with Similar Stocks
Dashboard
With a Operating Losses, the company has a Weak Long Term Fundamental Strength
- The company has been able to generate a Return on Equity (avg) of 2.21% signifying low profitability per unit of shareholders funds
Flat results in Dec 25
With ROE of 0.9, it has a Very Expensive valuation with a 0.4 Price to Book Value
Underperformed the market in the last 1 year
Stock DNA
Industrial Manufacturing
INR 387 Cr (Micro Cap)
10.00
44
0.00%
-0.02
0.90%
0.45
Total Returns (Price + Dividend) 
Latest dividend: 4 per share ex-dividend date: Aug-05-2024
Risk Adjusted Returns v/s
Returns Beta

News
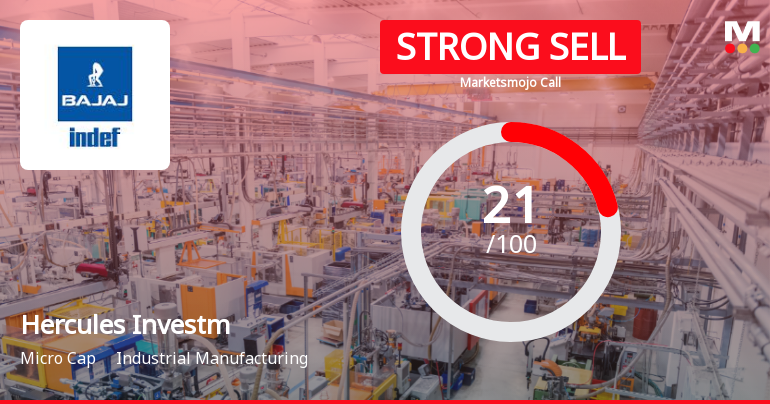
Hercules Investments Ltd Downgraded to Strong Sell Amidst Weak Fundamentals and Expensive Valuation
Hercules Investments Ltd has been assigned a Strong Sell rating with a Mojo Score of 21.0, reflecting significant concerns across quality, valuation, financial trends, and technical parameters. The downgrade from a previously ungraded status highlights deteriorating fundamentals and an expensive valuation despite subdued market performance.
Read full news article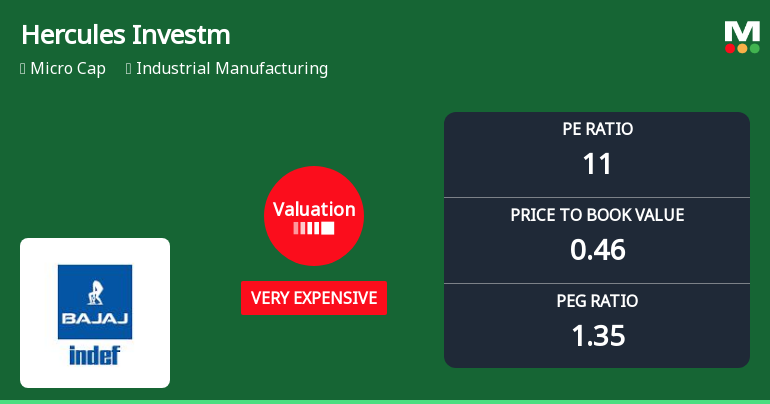
Hercules Investments Ltd Valuation Shifts Signal Elevated Price Risk
Hercules Investments Ltd, a micro-cap player in the industrial manufacturing sector, has seen a marked shift in its valuation parameters, moving from a 'risky' to a 'very expensive' rating. Despite a modest day gain of 0.69%, the company’s price-to-earnings (P/E) ratio and other valuation metrics suggest heightened price risk compared to historical and peer averages, raising concerns for investors amid a challenging market backdrop.
Read full news article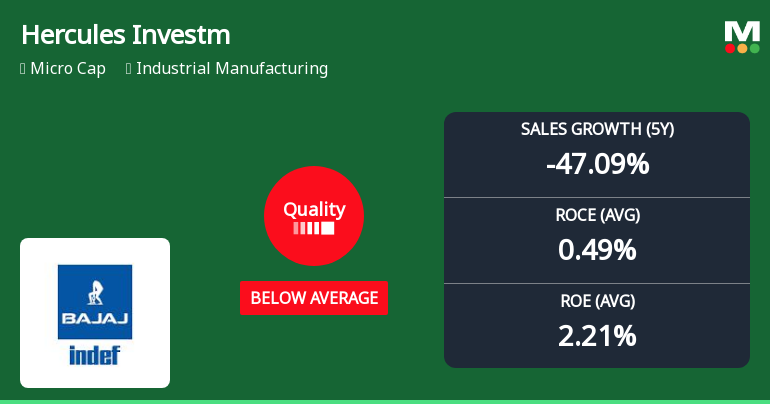
Hercules Investments Ltd Downgraded to Below Average Quality Amid Weak Financial Metrics
Hercules Investments Ltd, a micro-cap player in the industrial manufacturing sector, has been downgraded to a below average quality grade following a comprehensive review of its financial fundamentals. Despite a modest day gain of 0.69%, the company’s long-term performance and key financial metrics reveal significant challenges, prompting a strong sell recommendation from MarketsMOJO.
Read full news article Announcements
Announcement under Regulation 30 (LODR)-Newspaper Publication
04-Jun-2026 | Source : BSEPlease find enclosed the Newspaper Publication published on dated 4th June 2026 for attention of Equity Shareholders of the Company in respect of transfer of equity shares to IEPF
Record Date For Dividend And Annual General Meeting (AGM) For FY 2025-26
03-Jun-2026 | Source : BSEPlease refer the attached intimation of the record date fixed as 6th August 2026 for the purpose of the Final Dividend and Annual General Meeting for FY 2025-26.
Announcement under Regulation 30 (LODR)-Newspaper Publication
29-May-2026 | Source : BSEPlease find enclosed the newspaper publication published in the newspapers Active Times (English) and Mumbai Lakshadeep (Marathi) on dated 29th May 2026
Corporate Actions

No Upcoming Board Meetings

Hercules Investments Ltd has declared 400% dividend, ex-date: 05 Aug 24

Hercules Investments Ltd has announced 1:10 stock split, ex-date: 17 Sep 08

Hercules Investments Ltd has announced 1:1 bonus issue, ex-date: 11 Jul 12

No Rights history available
Quality key factors
Valuation key factors
Technicals key factors
 Technical Indicator Scale: Bearish, Mildly Bearish, Sideways, Mildly Bullish, Bullish Turned
 Shareholding Snapshot : Mar 2026
Shareholding Compare (%holding)
Promoters
None
Held by 0 Schemes
Held by 2 FIIs (0.0%)
Bajaj Holdings And Investment Ltd (19.53%)
Heinrich De Fries Gmbh (5%)
22.55%
Quarterly Results Snapshot (Standalone) - Mar'26 - QoQ

QoQ Growth in quarter ended Mar 2026 is -90.20% vs 0.00% in Dec 2025
QoQ Growth in quarter ended Mar 2026 is -103.07% vs -49.81% in Dec 2025
Half Yearly Results Snapshot (Standalone) - Sep'25
Growth in half year ended Sep 2025 is 0.00% vs 0.00% in Sep 2024

Growth in half year ended Sep 2025 is 82.11% vs -79.24% in Sep 2024
Nine Monthly Results Snapshot (Standalone) - Dec'25
YoY Growth in nine months ended Dec 2025 is 0.00% vs 0.00% in Dec 2024
YoY Growth in nine months ended Dec 2025 is 39.78% vs -76.86% in Dec 2024
Annual Results Snapshot (Standalone) - Mar'26
YoY Growth in year ended Mar 2026 is 44.88% vs 0.00% in Mar 2025
YoY Growth in year ended Mar 2026 is 38.35% vs -36.81% in Mar 2025
About Hercules Investments Ltd

Company Coordinates


