
Compare Hester Bios with Similar Stocks
Dashboard
Low ability to service debt as the company has a high Debt to EBITDA ratio of 2.25 times
- Poor long term growth as Net Sales has grown by an annual rate of 9.19% and Operating profit at 4.14% over the last 5 years
- Low ability to service debt as the company has a high Debt to EBITDA ratio of 2.25 times
- The company has been able to generate a Return on Capital Employed (avg) of 8.56% signifying low profitability per unit of total capital (equity and debt)
Poor long term growth as Net Sales has grown by an annual rate of 9.19% and Operating profit at 4.14% over the last 5 years
The company has declared Positive results for the last 8 consecutive quarters
With ROCE of 12.4, it has a Very Expensive valuation with a 3.4 Enterprise value to Capital Employed
Stock DNA
Pharmaceuticals & Biotechnology
INR 1,644 Cr (Micro Cap)
31.00
27
0.36%
0.52
14.91%
4.65
Total Returns (Price + Dividend) 
Latest dividend: 7 per share ex-dividend date: Aug-06-2025
Risk Adjusted Returns v/s
Returns Beta

News

Hester Biosciences Ltd Shows Bullish Momentum Amid Technical Upgrades
Hester Biosciences Ltd has transitioned from a sideways technical trend to a bullish momentum phase, supported by a series of positive signals across key technical indicators. The micro-cap pharmaceutical and biotechnology company’s recent upgrade from a Sell to a Hold rating reflects improving market sentiment and a strengthening price structure, with notable gains outpacing the broader Sensex over multiple timeframes.
Read full news article
Golden Cross Forms in Hester Biosciences Ltd Amid Mixed Technical Signals
The 50-day moving average has crossed above the 200-day moving average for Hester Biosciences Ltd, signalling a golden cross on 11 Jun 2026. Yet, the broader technical and fundamental picture presents a nuanced view that tempers the enthusiasm typically associated with this event.
Read full news article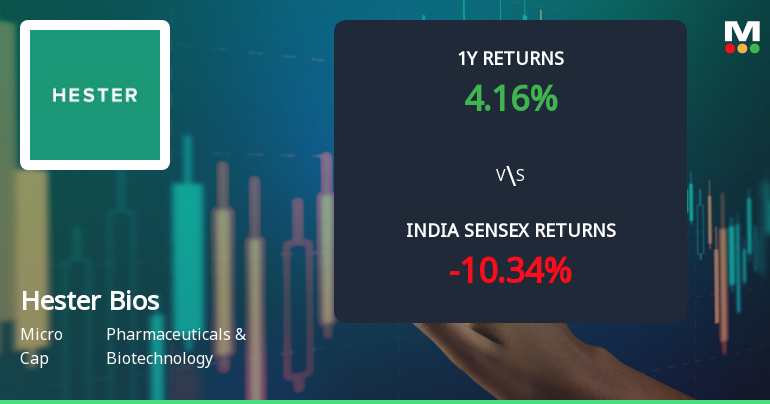
Hester Biosciences Ltd Technical Momentum Shifts Amid Mixed Market Signals
Hester Biosciences Ltd has experienced a notable shift in its technical momentum, moving from a mildly bullish stance to a sideways trend, reflecting a complex interplay of technical indicators. Despite a recent downgrade in daily moving averages to mildly bearish, weekly and monthly signals present a nuanced picture for investors navigating this pharmaceuticals and biotechnology micro-cap.
Read full news article Announcements
Hester Biosciences Limited - Outcome of Board Meeting
06-Nov-2019 | Source : NSEHester Biosciences Limited has informed the Exchange regarding Board meeting held on November 06, 2019.
Hester Biosciences Limited - Analysts/Institutional Investor Meet/Con. Call Updates
31-Oct-2019 | Source : NSEHester Biosciences Limited has informed the Exchange regarding Analysts/Institutional Investor Meet/Con. Call Updates
Shareholders meeting
05-Aug-2019 | Source : NSE
| There is Discrepancies in earlier filed Voting Results. So we have rectified the error and uploaded revised file. |
Corporate Actions

No Upcoming Board Meetings

Hester Biosciences Ltd has declared 70% dividend, ex-date: 06 Aug 25

No Splits history available

Hester Biosciences Ltd has announced 1:2 bonus issue, ex-date: 27 Sep 12

Hester Biosciences Ltd has announced 2:5 rights issue, ex-date: 29 May 06
Quality key factors
Valuation key factors
Technicals key factors
 Technical Indicator Scale: Bearish, Mildly Bearish, Sideways, Mildly Bullish, Bullish Turned
 Shareholding Snapshot : Mar 2026
Shareholding Compare (%holding)
Promoters
None
Held by 2 Schemes (0.0%)
Held by 15 FIIs (0.38%)
Rajiv Dinesh Gandhi (10.48%)
Kuntal Hasmukhlal Shah (3.17%)
33.29%
Quarterly Results Snapshot (Consolidated) - Mar'26 - YoY

YoY Growth in quarter ended Mar 2026 is 22.19% vs 3.37% in Mar 2025
YoY Growth in quarter ended Mar 2026 is 1,138.76% vs -73.94% in Mar 2025
Half Yearly Results Snapshot (Consolidated) - Sep'25

Growth in half year ended Sep 2025 is -6.56% vs 4.83% in Sep 2024
Growth in half year ended Sep 2025 is 112.45% vs 45.98% in Sep 2024
Nine Monthly Results Snapshot (Consolidated) - Dec'25
YoY Growth in nine months ended Dec 2025 is 1.44% vs 1.73% in Dec 2024
YoY Growth in nine months ended Dec 2025 is 51.37% vs 87.95% in Dec 2024
Annual Results Snapshot (Consolidated) - Mar'26
YoY Growth in year ended Mar 2026 is 6.91% vs 2.15% in Mar 2025
YoY Growth in year ended Mar 2026 is 102.40% vs 45.53% in Mar 2025
About Hester Biosciences Ltd

Company Coordinates


