
Compare Hexa Tradex with Similar Stocks
Stock DNA
Non Banking Financial Company (NBFC)
INR 961 Cr (Micro Cap)
NA (Loss Making)
21
0.00%
0.00
-0.27%
0.20
Total Returns (Price + Dividend) 
Hexa Tradex for the last several years.
Risk Adjusted Returns v/s
Returns Beta

News
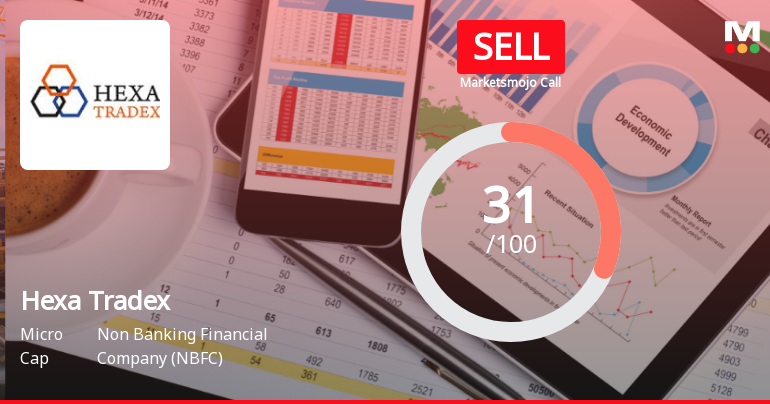
Hexa Tradex Ltd Upgraded to Sell on Technical Improvements Despite Flat Financials
Hexa Tradex Ltd, a micro-cap player in the Non Banking Financial Company (NBFC) sector, has seen its investment rating upgraded from Strong Sell to Sell as of 8 June 2026. This change is primarily driven by a shift in technical indicators, even as the company continues to face significant financial headwinds and valuation concerns. Our detailed analysis explores the four key parameters influencing this rating adjustment: Quality, Valuation, Financial Trend, and Technicals.
Read full news article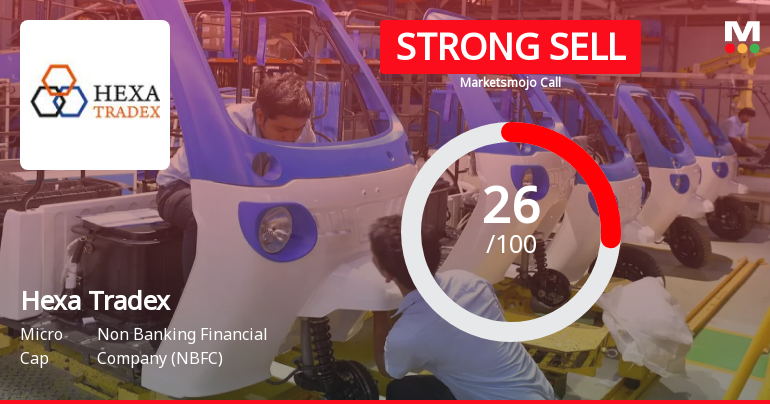
Hexa Tradex Ltd Downgraded to Strong Sell Amid Technical and Financial Weakness
Hexa Tradex Ltd, a micro-cap player in the Non Banking Financial Company (NBFC) sector, has been downgraded from a Sell to a Strong Sell rating by MarketsMOJO as of 3 June 2026. This revision reflects deteriorating technical indicators, stagnant financial performance, and valuation concerns, signalling heightened risk for investors amid a challenging market environment.
Read full news article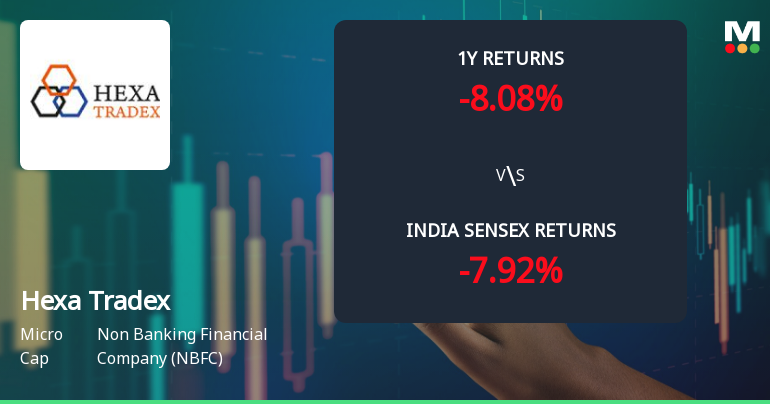
Hexa Tradex Ltd Technical Momentum Shifts Amid Bearish Sentiment
Hexa Tradex Ltd, a micro-cap player in the Non Banking Financial Company (NBFC) sector, has experienced a notable shift in its technical momentum, with key indicators signalling a bearish trend. Despite some mildly bullish weekly signals, the overall technical landscape points to increased selling pressure, reflected in the company’s recent price performance and downgraded market sentiment.
Read full news article Announcements
Reg. 34 (1) Annual Report.
29-May-2026 | Source : BSEAnnual Report for FY 2025-26
Compliances-Reg.24(A)-Annual Secretarial Compliance
29-May-2026 | Source : BSEAnnual Secretarial Compliance Report for FY 2025-26
Announcement under Regulation 30 (LODR)-Change in Management
11-May-2026 | Source : BSEas attached
Corporate Actions

No Upcoming Board Meetings

No Dividend history available

No Splits history available

No Bonus history available

No Rights history available
Quality key factors
Valuation key factors
Technicals key factors
 Technical Indicator Scale: Bearish, Mildly Bearish, Sideways, Mildly Bullish, Bullish Turned
 Shareholding Snapshot : Mar 2026
Shareholding Compare (%holding)
Promoters
None
Held by 5 Schemes (0.01%)
Held by 9 FIIs (0.04%)
Nalwa Sons Investments Limited (19.39%)
Anil Kantiprasad Poddar (2.26%)
6.49%
Quarterly Results Snapshot (Consolidated) - Mar'26 - QoQ

QoQ Growth in quarter ended Mar 2026 is 7,150.00% vs -99.36% in Dec 2025
QoQ Growth in quarter ended Mar 2026 is 23.68% vs -388.76% in Dec 2025
Half Yearly Results Snapshot (Consolidated) - Sep'25
Growth in half year ended Sep 2025 is 1.63% vs -96.83% in Sep 2024
Growth in half year ended Sep 2025 is 97.79% vs -173.70% in Sep 2024
Nine Monthly Results Snapshot (Consolidated) - Dec'25
YoY Growth in nine months ended Dec 2025 is 2.29% vs -97.76% in Dec 2024
YoY Growth in nine months ended Dec 2025 is 74.59% vs -122.66% in Dec 2024
Annual Results Snapshot (Consolidated) - Mar'26
YoY Growth in year ended Mar 2026 is 0.44% vs -96.58% in Mar 2025
YoY Growth in year ended Mar 2026 is 65.05% vs -127.03% in Mar 2025
About Hexa Tradex Ltd

Company Coordinates


