
Compare Hexaware Tech. with Similar Stocks
Dashboard
Strong Long Term Fundamental Strength with an average Return on Equity (ROE) of 21.61%
- Healthy long term growth as Net Sales has grown by an annual rate of 27.80% and Operating profit at 21.23%
- The company is Net-Debt Free
Flat results in Mar 26
With ROE of 23.3, it has a Fair valuation with a 4.8 Price to Book Value
100% of Promoter Shares are Pledged
Underperformed the market in the last 1 year
Stock DNA
Computers - Software & Consulting
INR 29,197 Cr (Mid Cap)
20.00
20
2.89%
-0.21
23.25%
4.76
Total Returns (Price + Dividend) 
Latest dividend: 8.511294430295647 per share ex-dividend date: May-05-2026
Risk Adjusted Returns v/s
Returns Beta

News
Hexaware Technologies Ltd is Rated Hold
Hexaware Technologies Ltd is rated 'Hold' by MarketsMOJO, with this rating last updated on 20 Feb 2026. While the rating change occurred on that date, the analysis and financial metrics presented here reflect the stock's current position as of 13 June 2026, providing investors with the latest insights into its performance and outlook.
Read full news article
Hexaware Technologies Ltd is Rated Hold
Hexaware Technologies Ltd is rated 'Hold' by MarketsMOJO, with this rating last updated on 20 February 2026. However, the analysis and financial metrics discussed here reflect the stock's current position as of 02 June 2026, providing investors with an up-to-date view of the company’s fundamentals, valuation, financial trends, and technical outlook.
Read full news article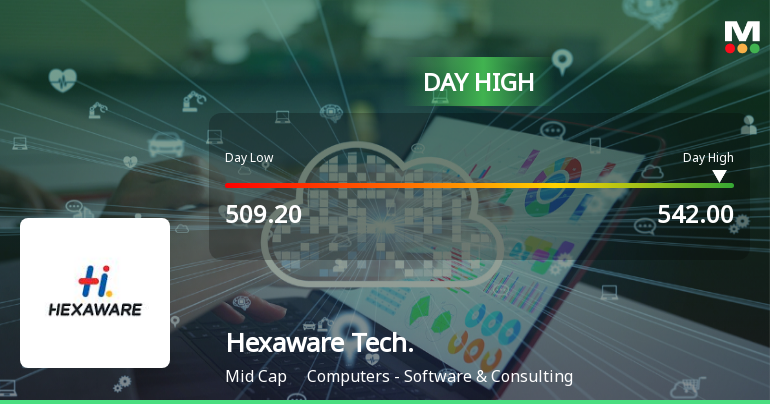
Hexaware Technologies Ltd Surges 5.1% to Day's High of Rs 541 — Outperforms Sector by 2.93 Percentage Points
The Sensex declined 0.41% on 2 Jun 2026 while Hexaware Technologies Ltd surged 5.1%, touching an intraday high of Rs 541. This 2.93 percentage-point outperformance over the IT - Software sector’s 2.18% gain highlights a distinctly stock-specific rally rather than a broad market lift.
Read full news article Announcements
Announcement under Regulation 30 (LODR)-Press Release / Media Release
17-Jun-2026 | Source : BSEPress Release
Announcement under Regulation 30 (LODR)-Press Release / Media Release
13-Jun-2026 | Source : BSEHexaware expands Presence in Gujarat with new delivery centre at Gift City
Intimation Under Regulation 30 Of LODR
12-Jun-2026 | Source : BSEUpdate
Corporate Actions

No Upcoming Board Meetings

Hexaware Technologies Ltd has declared 850% dividend, ex-date: 05 May 26

No Splits history available

Hexaware Technologies Ltd has announced 1:1 bonus issue, ex-date: 24 Feb 11

No Rights history available
Quality key factors
Valuation key factors
Technicals key factors
 Technical Indicator Scale: Bearish, Mildly Bearish, Sideways, Mildly Bullish, Bullish Turned
 Shareholding Snapshot : Mar 2026
Shareholding Compare (%holding)
Promoters
100
Held by 25 Schemes (14.54%)
Held by 149 FIIs (4.2%)
Ca Magnum Holdings (74.3%)
Hdfc Large And Mid Cap Fund (3.57%)
3.73%
Quarterly Results Snapshot (Consolidated) - Mar'26 - YoY

YoY Growth in quarter ended Mar 2026 is 12.63% vs 16.70% in Mar 2025
YoY Growth in quarter ended Mar 2026 is 7.46% vs 17.02% in Mar 2025
Half Yearly Results Snapshot (Consolidated) - Jun'25
Not Applicable: The company has declared_date for only one period
Not Applicable: The company has declared_date for only one period
Nine Monthly Results Snapshot (Consolidated) - Sep'25
YoY Growth in nine months ended Sep 2025 is 12.84% vs 87.79% in Sep 2024
YoY Growth in nine months ended Sep 2025 is 25.63% vs 74.96% in Sep 2024
Annual Results Snapshot (Consolidated) - Dec'25
YoY Growth in year ended Dec 2025 is 12.16% vs 15.36% in Dec 2024
YoY Growth in year ended Dec 2025 is 16.39% vs 17.92% in Dec 2024
About Hexaware Technologies Ltd

Company Coordinates


