
Compare Highway Infra with Similar Stocks
Total Returns (Price + Dividend) 
Highway Infra for the last several years.
Risk Adjusted Returns v/s
Returns Beta

News

MarketsMOJO Upgrades Highway Infrastructure Ltd to Hold on Improved Valuation and Technicals
Highway Infrastructure Ltd has seen its investment rating upgraded from Sell to Hold as of 3 June 2026, reflecting a nuanced shift in its overall profile. The upgrade follows a detailed reassessment across four key parameters: Quality, Valuation, Financial Trend, and Technicals. Despite some deterioration in quality metrics, improvements in valuation and technical indicators have supported a more balanced outlook for this micro-cap construction company.
Read full news article
Highway Infrastructure Ltd Downgraded to Sell Amid Deteriorating Fundamentals and Bearish Technicals
Highway Infrastructure Ltd has seen its investment rating downgraded from Hold to Sell, reflecting a deterioration in key quality and technical parameters despite an attractive valuation. The micro-cap construction company’s recent performance and market trends have prompted a reassessment of its prospects, signalling caution for investors.
Read full news article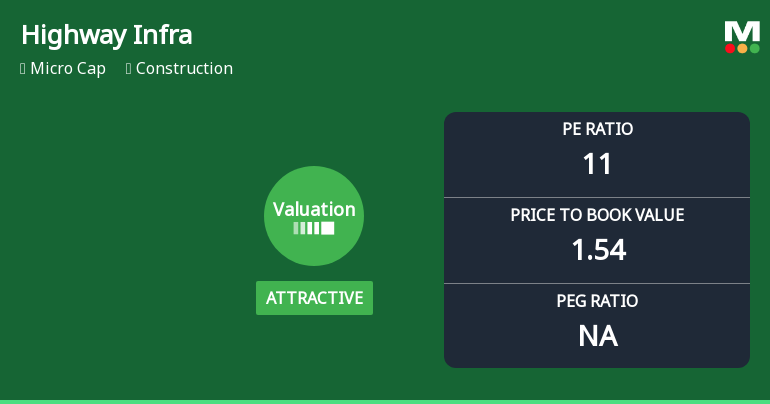
Highway Infrastructure Ltd Valuation Shifts Signal Changing Market Sentiment
Highway Infrastructure Ltd has witnessed a notable shift in its valuation parameters, moving from a very attractive to an attractive price level, despite ongoing market headwinds and a micro-cap status. This article analyses the recent changes in key valuation metrics such as the price-to-earnings (P/E) and price-to-book value (P/BV) ratios, compares them with peer averages and historical benchmarks, and assesses the implications for investors amid a challenging construction sector environment.
Read full news article Announcements
Shareholder Meeting / Postal Ballot-Notice of Postal Ballot
09-Jun-2026 | Source : BSEPostal Ballot Notice
Announcement under Regulation 30 (LODR)-Amendments to Memorandum & Articles of Association
06-Jun-2026 | Source : BSEalteration in article of the company.
Board Meeting Outcome for Alteration In Article Of Association Of The Company And Reappointment Of Managing Director And Whole Time Director For A Further Period Of Three - Year.
06-Jun-2026 | Source : BSEAlteration in Article of Association of the Company and Reappointment of Managing Director and Whole Time Director for a further period of three - year.
Corporate Actions

No Upcoming Board Meetings

No Dividend history available

No Splits history available

No Bonus history available

No Rights history available
Quality key factors
Valuation key factors
Technicals key factors
 Technical Indicator Scale: Bearish, Mildly Bearish, Sideways, Mildly Bullish, Bullish Turned
 Shareholding Snapshot : Mar 2026
Shareholding Compare (%holding)
Promoters
None
Held by 0 Schemes
Held by 2 FIIs (0.01%)
Anoop Agrawal (26.78%)
Rachna Agrawal (3.15%)
27.8%
Quarterly Results Snapshot (Standalone) - Mar'26 - QoQ

QoQ Growth in quarter ended Mar 2026 is 111.96% vs 45.24% in Dec 2025
QoQ Growth in quarter ended Mar 2026 is 50.41% vs -36.35% in Dec 2025
Half Yearly Results Snapshot (Standalone) - Sep'25
Not Applicable: The company has declared_date for only one period
Not Applicable: The company has declared_date for only one period
Nine Monthly Results Snapshot (Standalone) - Dec'25
Not Applicable: The company has declared_date for only one period
Not Applicable: The company has declared_date for only one period
Annual Results Snapshot (Standalone) - Mar'26
Not Applicable: The company has declared_date for only one period
Not Applicable: The company has declared_date for only one period
About Highway Infrastructure Ltd

Company Coordinates


