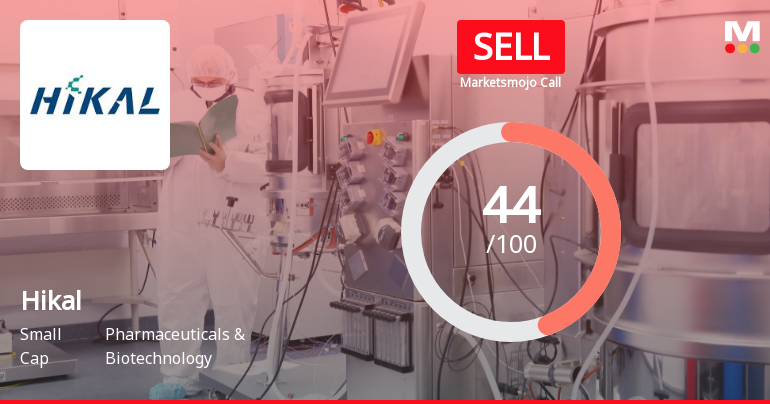
Hikal

  • Market Cap: Small Cap
  • Industry: Pharmaceuticals & Biotechnology
  • ISIN: INE475B01022
  • NSEID: HIKAL
  • BSEID: 524735
INR
232.75
4.9 (2.15%)
BSENSE

Sep 23, 03:30 PM

BSE+NSE Vol: 14.03 lacs

  • Price Points
  • Score
  • Mojo Parameters
  • Total Return
  • News and Corporate Actions
  • Key factors
  • Shareholding
  • Financials
  • CompanyCV
stock-summaryPrice Point
High/Low

1Day

52 Week

Valuation
Technical
Day's Volume

CASH

14.03 lacs (81.60%) Volume

Shareholding (Jun 2026)

FII

0.99%

Held by 32 FIIs

DII

7.23%

Held by 7 DIIs

Promoter

68.85%

Why is Hikal Ltd falling/rising?

06-Sep-2026

As of 05-Sep, Hikal Ltd's stock price is falling to 222.20, down 7.88%, following a trend reversal after previous gains. The company has underperformed significantly over the past year and has weak long-term fundamentals, raising concerns about its financial health.

As of 05-Sep, Hikal Ltd's stock price is falling, currently at 222.20, reflecting a decrease of 19.0 points or 7.88%. This decline follows a trend reversal after two consecutive days of gains, indicating a shift in market sentiment. The stock has underperformed its sector by 7.43% today and reached an intraday low of Rs 220.5, which is an 8.58% drop.<BR><BR>Over the past year, Hikal Ltd has generated a return of -14.65%, with profits falling by 33%. This consistent underperformance against the benchmark, particularly over the last three years, has contributed to investor concerns. The company's weak long-term fundamentals are highlighted by a -25.23% compound annual growth rate in operating profits over the last five years and a high debt to EBITDA ratio of 3.10 times, indicating low ability to service debt.<BR><BR>Despite trading at a discount compared to its peers and showing some positive indicators such as rising investor participation and trading above various moving averages, the overall financial health of the company remains a significant concern. The recent flat results, with a profit before tax of Rs -20.60 crore and a profit after tax of Rs -16.30 crore, further exacerbate the negative outlook, leading to the current decline in stock price.

View full answer

Who are in the management team of Hikal?

01-Sep-2026

The management team of Hikal includes Jai Hiremath (Executive Chairman), Sameer Hiremath (Managing Director), and several non-executive and independent directors, such as Baba Kalyani, Kannan Unni, and Shivani Bhasin Sachdeva, among others. They oversee the company's strategic direction and governance.

The management team of Hikal includes the following key individuals:<BR><BR>1. **Jai Hiremath** - Executive Chairman<BR>2. **Sameer Hiremath** - Managing Director<BR>3. **Baba Kalyani** - Non-Executive & Non-Independent Director<BR>4. **Kannan Unni** - Non-Executive & Independent Director<BR>5. **Sugandha Hiremath** - Non-Executive & Non-Independent Director<BR>6. **Prakash V Mehta** - Non-Executive & Independent Director<BR>7. **Amit B Kalyani** - Non-Executive & Non-Independent Director<BR>8. **Ranjit Shahani** - Non-Executive & Independent Director<BR>9. **Shivani Bhasin Sachdeva** - Non-Executive & Independent Director<BR>10. **Rajasekhar Reddy** - Company Secretary & Compliance Officer<BR>11. **Shrikrishna K. Adivarekar** - Independent Director<BR>12. **Berjis Minoo Desai** - Independent Director<BR>13. **V R Kaundinya** - Independent Director<BR><BR>This team is responsible for guiding the company's strategic direction and governance.

View full answer

What does Hikal do?

01-Sep-2026

Hikal Ltd is a small-cap company in the Pharmaceuticals & Biotechnology sector, specializing in chemical intermediates, specialty chemicals, and active pharmaceutical ingredients. As of June 2026, it reported net sales of 403 Cr and a net loss of 7 Cr, with a market cap of INR 2,478 Cr.

Overview:<BR>Hikal Ltd is a small-cap company operating in the Pharmaceuticals & Biotechnology industry, specializing in the manufacturing of chemical intermediates, specialty chemicals, active pharmaceutical ingredients, and contract research activities.<BR><BR>History:<BR>Hikal Ltd was incorporated on July 8, 1988. The latest quarterly results reported are for June 2026, showing net sales and profit figures.<BR><BR>Financial Snapshot:<BR>Net Sales: 403 Cr (Quarterly Results - Jun 2026) <BR>Net Profit: -7 Cr (Quarterly Results - Jun 2026) <BR>Market Cap: INR 2,478 Cr (Small Cap)<BR><BR>Key Metrics:<BR>P/E: 59.00 <BR>Industry P/E: 37 <BR>Dividend Yield: 0.49% <BR>Debt-Equity: 0.56 <BR>Return on Equity: 3.03% <BR>Price to Book: 2.10 <BR><BR>Contact Details:<BR>Address: 717/718 Maker Chamber V, 7th Floor Nariman Point Mumbai Maharashtra : 400021 <BR>Tel: 91-022-3926 7100/62770477 <BR>Email: secretarial@hikal.com/info@hikal.co <BR>Website: http://www.hikal.com

View full answer

Who are the peers of the Hikal?

01-Sep-2026

Hikal's peers include Kwality Pharma, Advanced Enzyme, Ind-Swift Labs, Solara Active, Dishman Carbogen, Fredun Pharma, Panacea Biotec, Indoco Remedies, and Beta Drugs Ltd. Hikal has below-average growth and capital structure, with a 1-year return of -20.90%, compared to Fredun Pharma's highest return of 279.00%.

Peers: The peers of Hikal are Kwality Pharma, Advanced Enzyme, Ind-Swift Labs., Solara Active, Dishman Carbogen, Fredun Pharma, Panacea Biotec, Indoco Remedies, and Beta Drugs Ltd.<BR><BR>Quality Snapshot: Excellent management risk is observed at Kwality Pharma and Advanced Enzyme, while Average management risk is found at Hikal, Fredun Pharma, and Indoco Remedies, and the rest. Below Average management risk is noted at Ind-Swift Labs., Solara Active, Dishman Carbogen, Panacea Biotec, and the rest. Growth is Excellent at Fredun Pharma, Average at Beta Drugs Ltd, and the rest, while Below Average growth is seen at Hikal, Kwality Pharma, Advanced Enzyme, Ind-Swift Labs., Solara Active, Dishman Carbogen, Panacea Biotec, Indoco Remedies, and the rest. Capital Structure is Excellent at Kwality Pharma and Beta Drugs Ltd, Average at Ind-Swift Labs., and Below Average at Hikal, Solara Active, Dishman Carbogen, Fredun Pharma, Panacea Biotec, Indoco Remedies, and the rest.<BR><BR>Return Snapshot: Fredun Pharma has the highest 1-year return at 279.00%, while Dishman Carbogen has the lowest at -32.34%. Hikal's 1-year return of -20.90% is lower than both. Additionally, Dishman Carbogen is the only peer with a negative six-month return.

View full answer

How big is Hikal?

01-Sep-2026

As of 31st August, Hikal Ltd has a market capitalization of 2,478.00 Cr, with net sales of 1,735.00 Cr and a net loss of 33.80 Cr over the latest four quarters. The company's shareholder's funds are 1,262.30 Cr, and total assets amount to 2,528.90 Cr.

As of 31st August, Hikal Ltd has a market capitalization of 2,478.00 Cr, categorizing it as a Small Cap company.<BR><BR>In the latest four quarters, Hikal reported net sales of 1,735.00 Cr. However, the company experienced a net loss of 33.80 Cr during this period.<BR><BR>The latest annual reporting period for Hikal shows shareholder's funds of 1,262.30 Cr and total assets amounting to 2,528.90 Cr.

View full answer

Should I buy, sell or hold Hikal Ltd?

07-Aug-2026

When is the next results date for Hikal Ltd?

31-Jul-2026

The next results date for Hikal Ltd is 06 August 2026.

The next results date for Hikal Ltd is scheduled for 06 August 2026.

View full answer

Are Hikal Ltd latest results good or bad?

28-May-2026

Hikal Ltd's latest results are largely negative, showing a 71.31% year-on-year decline in net profit and a 5.97% decrease in revenue, despite a modest quarter-on-quarter improvement. The company faces challenges, particularly in its crop protection segment, and its stock has underperformed significantly over the past year.

Hikal Ltd's latest results present a mixed picture, leaning towards the negative. In Q4 FY26, the company reported a net profit of ₹14.40 crores, which, while an improvement from a loss of ₹5.90 crores in the previous quarter, reflects a significant decline of 71.31% year-on-year from ₹50.20 crores. Revenue for the quarter was ₹519.40 crores, showing a modest quarter-on-quarter increase of 5.08% but a year-on-year decrease of 5.97%.<BR><BR>The operating margin improved to 20.39% from 16.85% in the previous quarter, but this is still down 204 basis points compared to the same quarter last year. Overall, the company is facing challenges, particularly in its crop protection segment, which has been affected by subdued global demand.<BR><BR>Additionally, Hikal's stock has underperformed significantly over the past year, declining by 40.92%, compared to a 6.97% fall in the Sensex. This underperformance raises concerns about the company's ability to navigate the current market conditions effectively.<BR><BR>In summary, while there are some signs of sequential recovery, the year-on-year declines in both profit and revenue, along with ongoing operational challenges, suggest that the latest results are not favorable overall.

View full answer

Has Hikal Ltd declared dividend?

13-Feb-2026

Yes, Hikal Ltd has declared a dividend of 10% (0.8 per share) with an ex-date of February 17, 2026. Despite the dividend, the company has experienced significant price declines over various periods, resulting in modest total returns.

Hikal Ltd has declared a dividend.<BR><BR>Dividend Details:<BR>- Percentage announced: 10%<BR>- Amount per share: 0.8<BR>- Ex-date: 17 Feb 26<BR><BR>Dividend Yield: 0.37%.<BR><BR>Total Returns by Period:<BR>In the last 3 months, Hikal Ltd experienced a price return of -11.18%, a dividend return of 0.08%, resulting in a total return of -11.1%.<BR><BR>Over the past 6 months, the company saw a price return of -16.63%, a dividend return of 0.39%, leading to a total return of -16.24%.<BR><BR>In the 1-year period, Hikal Ltd reported a price return of -39.05%, a dividend return of 0.29%, culminating in a total return of -38.76%.<BR><BR>For the 2-year period, the price return was -23.52%, with a dividend return of 0.78%, resulting in a total return of -22.74%.<BR><BR>In the 3-year timeframe, the company had a price return of -35.23%, a dividend return of 1.13%, which gave a total return of -34.1%.<BR><BR>Over the last 4 years, Hikal Ltd experienced a price return of -49.8%, a dividend return of 1.25%, leading to a total return of -48.55%.<BR><BR>Finally, in the 5-year period, the company achieved a price return of 27.87%, a dividend return of 4.15%, resulting in a total return of 32.02%.<BR><BR>Overall, while Hikal Ltd has declared a dividend, the total returns over various periods indicate significant price declines, particularly in the shorter terms, despite some recovery in the longer term. The dividend yield remains modest in comparison to the price performance.

View full answer

Is Hikal overvalued or undervalued?

05-Dec-2025

As of December 4, 2025, Hikal's valuation has shifted from attractive to fair, with a high PE ratio of 309.11 and significant underperformance at -35.04% year-to-date, indicating concerns about its growth prospects compared to peers like Sun Pharma and Cipla.

As of 4 December 2025, Hikal's valuation grade has moved from attractive to fair, indicating a shift in its perceived value. The company is currently fairly valued, with a PE ratio of 309.11, an EV to EBITDA of 16.62, and a Price to Book Value of 2.61. In comparison to peers, Sun Pharma has a PE ratio of 37.78 and an EV to EBITDA of 24.99, while Cipla is rated attractive with a PE of 22.58 and an EV to EBITDA of 15.98, highlighting Hikal's significant overvaluation relative to its competitors.<BR><BR>Despite its fair valuation, Hikal has underperformed in the market, with a year-to-date return of -35.04% compared to the Sensex's 9.12%. This underperformance, coupled with a high PEG ratio of 0.00 and low ROE of 0.85%, suggests that investors may be cautious about the company's growth prospects moving forward.

View full answer

Is Hikal technically bullish or bearish?

04-Dec-2025

As of December 3, 2025, Hikal's technical trend is mildly bearish, with mixed signals from indicators like the MACD and Bollinger Bands, suggesting a cautious outlook in the short term.

As of 3 December 2025, the technical trend for Hikal has changed from bearish to mildly bearish. The current stance is mildly bearish, driven by several key indicators. The weekly MACD is mildly bullish, but the monthly MACD remains bearish, indicating mixed signals. The Bollinger Bands and moving averages are both mildly bearish on the weekly and daily time frames. The KST shows a mildly bullish signal on the weekly, while the monthly remains bearish. The Dow Theory also reflects a mildly bullish stance on the weekly but is bearish on the monthly. Overall, the indicators suggest a cautious outlook with a slight bearish bias in the short term.

View full answer

How has been the historical performance of Hikal?

14-Nov-2025

Hikal's historical performance shows mixed results, with net sales peaking at 2,023.03 Cr in Mar'23 before declining to 1,859.80 Cr in Mar'25, while operating profit increased slightly to 333.40 Cr in Mar'25, despite decreases in profit before and after tax. Total assets and liabilities rose to 2,528.90 Cr in Mar'25, and cash flow from operating activities improved to 280.00 Cr.

Answer:<BR>The historical performance of Hikal shows a mixed trend in its financial metrics over the years.<BR><BR>Breakdown:<BR>Hikal's net sales have fluctuated, with a peak of 2,023.03 Cr in Mar'23, followed by a decline to 1,859.80 Cr in Mar'25. The total operating income mirrored this trend, reaching 2,023.03 Cr in Mar'23 and decreasing to 1,859.80 Cr in Mar'25. Raw material costs rose to 882.60 Cr in Mar'25 from 781.90 Cr in Mar'20, while total expenditure (excluding depreciation) decreased to 1,531.40 Cr in Mar'25 from 1,765.96 Cr in Mar'23. Operating profit (PBDIT) saw a slight increase to 333.40 Cr in Mar'25 from 262.48 Cr in Mar'23, although profit before tax dropped to 123.80 Cr in Mar'25 from 105.37 Cr in Mar'23. Profit after tax also decreased to 90.80 Cr in Mar'25 from 78.39 Cr in Mar'23. The company's total assets increased to 2,528.90 Cr in Mar'25 from 2,385.48 Cr in Mar'23, while total liabilities rose to 2,528.90 Cr in Mar'25 from 2,385.48 Cr in Mar'23. Cash flow from operating activities improved to 280.00 Cr in Mar'25 from 186.00 Cr in Mar'24, indicating a positive trend in cash generation. Overall, Hikal's financial performance reflects both challenges and improvements across various metrics over the years.

View full answer

Who are the top shareholders of the Hikal?

17-Jul-2025

The top shareholders of Hikal include Kalyani Investment Company Limited with 31.36%, followed by 76 Foreign Institutional Investors holding 5.69%, and mutual funds with a combined 2.93%. Individual investors own 16.57%, with Tata Mutual Fund - Tata Small Cap Fund being the largest public shareholder at 2.68%.

The top shareholders of Hikal include the promoters, who hold the majority of the shares. The promoter with the highest holding is Kalyani Investment Company Limited, which owns 31.36% of the company. Additionally, there are 76 Foreign Institutional Investors (FIIs) holding 5.69%, and mutual funds are represented by 7 schemes with a combined holding of 2.93%. The highest public shareholder is Tata Mutual Fund - Tata Small Cap Fund, which holds 2.68%. Individual investors collectively own 16.57% of the shares.

View full answer

What is the bonus history of the Hikal?

06-Jun-2025

Hikal Ltd announced a 1:2 bonus issue on June 22, 2018, with a record date of June 25, 2018, meaning shareholders received one additional share for every two shares held.

Hikal Ltd has a bonus history that includes a 1:2 bonus issue announced on June 22, 2018. The record date for this bonus was June 25, 2018. This means that for every two shares held, shareholders received one additional share as a bonus.

View full answer
iScoreScore

Dashboard

1

Weak Long Term Fundamental Strength with a -25.23% CAGR growth in Operating Profits over the last 5 years

  • Low ability to service debt as the company has a high Debt to EBITDA ratio of 3.10 times
  • The company has been able to generate a Return on Equity (avg) of 7.60% signifying low profitability per unit of shareholders funds
2

Flat results in Jun 26

3

Consistent Underperformance against the benchmark over the last 3 years

stock-summaryMojo Parameters

Mojo Parameters

Loading Valuation Snapshot...

Stock DNA

stock-summary
Industry

Pharmaceuticals & Biotechnology

stock-summary
Market cap

INR 2,866 Cr (Small Cap)

stock-summary
P/E

67.00

stock-summary
Industry P/E

37

stock-summary
Dividend Yield

0.27%

stock-summary
Debt Equity

0.56

stock-summary
Return on Equity

3.03%

stock-summary
Price to Book

2.32

Revenue and Profits:
Net Sales:
403 Cr
(Quarterly Results - Jun 2026)
Net Profit:
-7 Cr
stock-summaryTotal Returns
Total Returns (Price + Dividend) stock-summary
Dividend Yield (0.27%)
TimePeriod
Price Return
Dividend Return
Total Return
3 Months
7.48%
0.19%
7.67%
6 Months
48.44%
0.27%
48.71%
1 Year
-10.5%
0.24%
-10.26%
2 Years
-38.69%
0.56%
-38.13%
3 Years
-22.55%
1.14%
-21.41%
4 Years
-30.73%
1.30%
-29.43%
5 Years
-63.58%
1.20%
-62.38%

Latest dividend: 0.4 per share ex-dividend date: Sep-04-2026

Risk Adjusted Returns v/s stock-summary
Returns Beta
Icon
Beta has not been calculated since enough price history is not available
stock-summaryNews & Corporate Actions

News

Hikal Ltd Gains 8.87%: 4 Key Factors Driving the Week’s Volatility

Key Events This Week

31 Aug: Stock opens week at Rs.201.75, down 1.15%

1 Sep: Technical momentum shifts amid bearish signals

3 Sep: Intraday high surge of 11.89%, closing at Rs.241.20 (+19.97%)

4 Sep: Shares hit intraday low amid price pressure, closing at Rs.222.20 (-7.88%)

Announcements stock-summary

Announcement under Regulation 30 (LODR)-Press Release / Media Release

22-Sep-2026 | Source : BSE

Press Release- Hikal ventures into Personal Care: New cGMP Panoli facility begins Commercial Production.

Announcement under Regulation 30 (LODR)-Analyst / Investor Meet - Intimation

02-Sep-2026 | Source : BSE

Intimation of Analyst and Investor meet pursuant to regulations 30 of SEBI (LODR) Regulations 2015

Announcement under Regulation 30 (LODR)-Newspaper Publication

01-Sep-2026 | Source : BSE

Newspaper Publication informing about 38th Annual General Meeting and information on e-Voting.

Corporate Actions stock-summary

stock-summary
BOARD MEETING

No Upcoming Board Meetings

stock-summary
DIVIDEND

Hikal Ltd has declared 20% dividend, ex-date: 04 Sep 26

stock-summary
SPLITS

Hikal Ltd has announced 2:10 stock split, ex-date: 27 Feb 15

stock-summary
BONUS

Hikal Ltd has announced 1:2 bonus issue, ex-date: 22 Jun 18

stock-summary
RIGHTS

No Rights history available

stock-summaryKey Factors

Quality key factors stock-summary

Factor
Value
Sales Growth (5y)
-1.00%
EBIT Growth (5y)
-25.23%
EBIT to Interest (avg)
2.79
Debt to EBITDA (avg)
2.67
Net Debt to Equity (avg)
0.56
Sales to Capital Employed (avg)
1.00
Tax Ratio
41.52%
Dividend Payout Ratio
10.88%
Pledged Shares
0
Institutional Holding
8.22%
ROCE (avg)
9.07%
ROE (avg)
7.60%

Valuation key factors

Factor
Value
P/E Ratio
67
Industry P/E
37
Price to Book Value
2.39
EV to EBIT
54.15
EV to EBITDA
15.20
EV to Capital Employed
1.89
EV to Sales
2.03
PEG Ratio
NA
Dividend Yield
0.26%
ROCE (Latest)
3.03%
ROE (Latest)
3.03%

Technicals key factors

Indicator
Weekly
Monthly
MACD
Bullish
Mildly Bullish
RSI
No Signal
No Signal
Bollinger Bands
Bullish
Mildly Bearish
Moving Averages
Bullish (Daily)
KST
Mildly Bearish
Bearish
Dow Theory
Mildly Bearish
No Trend
OBV
Mildly Bearish
Bullish
stock-summary Technical Indicator Scale: Bearish, Mildly Bearish, Sideways, Mildly Bullish, Bullish  Turned 
stock-summaryShareholding
Shareholding Snapshot : Jun 2026stock-summary
Shareholding Compare (%holding) stock-summary
Majority shareholders

Promoters

Pledged Promoter Holdings

None

Mutual Funds

Held by 4 Schemes (5.92%)

FIIs

Held by 32 FIIs (0.99%)

Promoter with highest holding

Kalyani Investment Company Limited (31.36%)

Highest Public shareholder

Icici Prudential Pharma Healthcare And Diaganostics (p.h.d) Fund (3.24%)

Individual Investors Holdings

17.84%

stock-summaryFinancial
[
  {
    "link": "quarterly",
    "btn_text": "All Quarterly Results",
    "header": "Quarterly Results Snapshot (Consolidated) - Jun'26 - QoQ",
    "rhs": [
      {
        "prefix": "Net Sales ",
        "suffix": "QoQ Growth in quarter ended Jun 2026 is -22.45% vs 5.08% in Mar 2026",
        "dir": -1
      },
      {
        "prefix": "Consolidated Net Profit ",
        "suffix": "QoQ Growth in quarter ended Jun 2026 is -151.39% vs 344.07% in Mar 2026",
        "dir": -1
      }
    ],
    "table": {
      "header": [
        "Jun'26",
        "Mar'26",
        "Change(%)"
      ],
      "body": [
        {
          "field": "Net Sales",
          "val1": "402.80",
          "val2": "519.40",
          "chgp": "-22.45%",
          "chgp_class": "negative"
        },
        {
          "field": "Operating Profit (PBDIT) excl Other Income",
          "val1": "37.00",
          "val2": "105.40",
          "chgp": "-64.90%",
          "chgp_class": "negative"
        },
        {
          "field": "Interest",
          "val1": "14.90",
          "val2": "14.60",
          "chgp": "2.05%",
          "chgp_class": "negative"
        },
        {
          "field": "Exceptional Items",
          "val1": "8.90",
          "val2": "-47.10",
          "chgp": "118.90%",
          "chgp_class": "positive"
        },
        {
          "field": "Consolidate Net Profit",
          "val1": "-7.40",
          "val2": "14.40",
          "chgp": "-151.39%",
          "chgp_class": "negative"
        },
        {
          "field": "Operating Profit Margin (Excl OI)",
          "val1": "9.25%",
          "val2": "20.39%",
          "chgp": "-11.14%",
          "chgp_class": "negative"
        }
      ]
    }
  },
  {
    "link": "half-yearly",
    "btn_text": "All Half Yearly Results",
    "header": "Half Yearly Results Snapshot (Consolidated) - Sep'25",
    "rhs": [
      {
        "prefix": "Net Sales ",
        "suffix": " Growth in half year ended Sep 2025 is -18.70% vs 4.47% in Sep 2024",
        "dir": -1
      },
      {
        "prefix": "Consolidated Net Profit ",
        "suffix": " Growth in half year ended Sep 2025 is -344.87% vs 20.06% in Sep 2024",
        "dir": -1
      }
    ],
    "table": {
      "header": [
        "Sep'25",
        "Sep'24",
        "Change(%)"
      ],
      "body": [
        {
          "field": "Net Sales",
          "val1": "698.90",
          "val2": "859.70",
          "chgp": "-18.70%",
          "chgp_class": "negative"
        },
        {
          "field": "Operating Profit (PBDIT) excl Other Income",
          "val1": "32.30",
          "val2": "132.90",
          "chgp": "-75.70%",
          "chgp_class": "negative"
        },
        {
          "field": "Interest",
          "val1": "32.00",
          "val2": "38.60",
          "chgp": "-17.10%",
          "chgp_class": "positive"
        },
        {
          "field": "Exceptional Items",
          "val1": "0.00",
          "val2": "0.00",
          "chgp": "",
          "chgp_class": "neutral"
        },
        {
          "field": "Consolidate Net Profit",
          "val1": "-57.30",
          "val2": "23.40",
          "chgp": "-344.87%",
          "chgp_class": "negative"
        },
        {
          "field": "Operating Profit Margin (Excl OI)",
          "val1": "4.70%",
          "val2": "15.55%",
          "chgp": "-10.85%",
          "chgp_class": "negative"
        }
      ]
    }
  },
  {
    "link": "nine-monthly",
    "btn_text": "All Nine Monthly Results",
    "header": "Nine Monthly Results Snapshot (Consolidated) - Dec'25",
    "rhs": [
      {
        "prefix": "Net Sales ",
        "suffix": "YoY Growth in nine months ended Dec 2025 is -8.73% vs 2.91% in Dec 2024",
        "dir": -1
      },
      {
        "prefix": "Consolidated Net Profit ",
        "suffix": "YoY Growth in nine months ended Dec 2025 is -255.67% vs 14.08% in Dec 2024",
        "dir": -1
      }
    ],
    "table": {
      "header": [
        "Dec'25",
        "Dec'24",
        "Change(%)"
      ],
      "body": [
        {
          "field": "Net Sales",
          "val1": "1,193.20",
          "val2": "1,307.40",
          "chgp": "-8.73%",
          "chgp_class": "negative"
        },
        {
          "field": "Operating Profit (PBDIT) excl Other Income",
          "val1": "115.00",
          "val2": "205.00",
          "chgp": "-43.90%",
          "chgp_class": "negative"
        },
        {
          "field": "Interest",
          "val1": "47.50",
          "val2": "57.30",
          "chgp": "-17.10%",
          "chgp_class": "positive"
        },
        {
          "field": "Exceptional Items",
          "val1": "-38.00",
          "val2": "0.00",
          "chgp": "",
          "chgp_class": "neutral"
        },
        {
          "field": "Consolidate Net Profit",
          "val1": "-63.20",
          "val2": "40.60",
          "chgp": "-255.67%",
          "chgp_class": "negative"
        },
        {
          "field": "Operating Profit Margin (Excl OI)",
          "val1": "9.64%",
          "val2": "15.68%",
          "chgp": "-6.04%",
          "chgp_class": "negative"
        }
      ]
    }
  },
  {
    "link": "annual",
    "btn_text": "All Annual Results",
    "header": "Annual Results Snapshot (Consolidated) - Mar'26",
    "rhs": [
      {
        "prefix": "Net Sales ",
        "suffix": "YoY Growth in year ended Mar 2026 is -7.91% vs 4.21% in Mar 2025",
        "dir": -1
      },
      {
        "prefix": "Consolidated Net Profit ",
        "suffix": "YoY Growth in year ended Mar 2026 is -153.74% vs 30.46% in Mar 2025",
        "dir": -1
      }
    ],
    "table": {
      "header": [
        "Mar'26",
        "Mar'25",
        "Change(%)"
      ],
      "body": [
        {
          "field": "Net Sales",
          "val1": "1,712.60",
          "val2": "1,859.80",
          "chgp": "-7.91%",
          "chgp_class": "negative"
        },
        {
          "field": "Operating Profit (PBDIT) excl Other Income",
          "val1": "220.40",
          "val2": "328.40",
          "chgp": "-32.89%",
          "chgp_class": "negative"
        },
        {
          "field": "Interest",
          "val1": "62.10",
          "val2": "75.20",
          "chgp": "-17.42%",
          "chgp_class": "positive"
        },
        {
          "field": "Exceptional Items",
          "val1": "-85.10",
          "val2": "0.00",
          "chgp": "",
          "chgp_class": "neutral"
        },
        {
          "field": "Consolidate Net Profit",
          "val1": "-48.80",
          "val2": "90.80",
          "chgp": "-153.74%",
          "chgp_class": "negative"
        },
        {
          "field": "Operating Profit Margin (Excl OI)",
          "val1": "13.00%",
          "val2": "17.81%",
          "chgp": "-4.81%",
          "chgp_class": "negative"
        }
      ]
    }
  }
]

Quarterly Results Snapshot (Consolidated) - Jun'26 - QoQstock-summary

Jun'26
Mar'26
Change(%)
Net Sales
402.80
519.40
-22.45%
Operating Profit (PBDIT) excl Other Income
37.00
105.40
-64.90%
Interest
14.90
14.60
2.05%
Exceptional Items
8.90
-47.10
118.90%
Consolidate Net Profit
-7.40
14.40
-151.39%
Operating Profit Margin (Excl OI)
9.25%
20.39%
-11.14%
Values in Rs Cr.
Direction Arrows
Net Sales

QoQ Growth in quarter ended Jun 2026 is -22.45% vs 5.08% in Mar 2026

Direction Arrows
Consolidated Net Profit

QoQ Growth in quarter ended Jun 2026 is -151.39% vs 344.07% in Mar 2026

Half Yearly Results Snapshot (Consolidated) - Sep'25stock-summary

Sep'25
Sep'24
Change(%)
Net Sales
698.90
859.70
-18.70%
Operating Profit (PBDIT) excl Other Income
32.30
132.90
-75.70%
Interest
32.00
38.60
-17.10%
Exceptional Items
0.00
0.00
Consolidate Net Profit
-57.30
23.40
-344.87%
Operating Profit Margin (Excl OI)
4.70%
15.55%
-10.85%
Values in Rs Cr.
Direction Arrows
Net Sales

Growth in half year ended Sep 2025 is -18.70% vs 4.47% in Sep 2024

Direction Arrows
Consolidated Net Profit

Growth in half year ended Sep 2025 is -344.87% vs 20.06% in Sep 2024

Nine Monthly Results Snapshot (Consolidated) - Dec'25stock-summary

Dec'25
Dec'24
Change(%)
Net Sales
1,193.20
1,307.40
-8.73%
Operating Profit (PBDIT) excl Other Income
115.00
205.00
-43.90%
Interest
47.50
57.30
-17.10%
Exceptional Items
-38.00
0.00
Consolidate Net Profit
-63.20
40.60
-255.67%
Operating Profit Margin (Excl OI)
9.64%
15.68%
-6.04%
Values in Rs Cr.
Direction Arrows
Net Sales

YoY Growth in nine months ended Dec 2025 is -8.73% vs 2.91% in Dec 2024

Direction Arrows
Consolidated Net Profit

YoY Growth in nine months ended Dec 2025 is -255.67% vs 14.08% in Dec 2024

Annual Results Snapshot (Consolidated) - Mar'26stock-summary

Mar'26
Mar'25
Change(%)
Net Sales
1,712.60
1,859.80
-7.91%
Operating Profit (PBDIT) excl Other Income
220.40
328.40
-32.89%
Interest
62.10
75.20
-17.42%
Exceptional Items
-85.10
0.00
Consolidate Net Profit
-48.80
90.80
-153.74%
Operating Profit Margin (Excl OI)
13.00%
17.81%
-4.81%
Values in Rs Cr.
Direction Arrows
Net Sales

YoY Growth in year ended Mar 2026 is -7.91% vs 4.21% in Mar 2025

Direction Arrows
Consolidated Net Profit

YoY Growth in year ended Mar 2026 is -153.74% vs 30.46% in Mar 2025

stock-summaryCompany CV
About Hikal Ltd stock-summary
stock-summary
Hikal Ltd
Small Cap
Pharmaceuticals & Biotechnology
Hikal Limited, incorporated on July 8, 1988, has emerged as one of the preferred partners for global companies in segments such as pharmaceuticals, crop protection, animal health, biocides, and specialty chemicals. The Company is engaged in the manufacturing of various chemical intermediates, specialty chemicals, active pharma ingredients and contract research activities. The Company has 5 manufacturing facilities across three states in India.
Company Coordinates stock-summary
Company Details
717/718 Maker Chamber V, 7th Floor Nariman Point Mumbai Maharashtra : 400021
stock-summary
Tel: 91-022-3926 7100/62770477
stock-summary
secretarial@hikal.com/info@hikal.co
Registrar Details
Mondkar Computers Pvt Ltd , 21 Shakil Niwas , Opp. Satya Saibaba Temple, Mahakali Caves Road, Andheri (E), Mumbai
Footer loading