
Compare Hilton Met.Forg. with Similar Stocks
Dashboard
Weak Long Term Fundamental Strength with an average Return on Capital Employed (ROCE) of 5.56%
- Poor long term growth as Operating profit has grown by an annual rate 19.71% of over the last 5 years
- Low ability to service debt as the company has a high Debt to EBITDA ratio of 4.42 times
Flat results in Mar 26
Consistent Underperformance against the benchmark over the last 3 years
Stock DNA
Castings & Forgings
INR 128 Cr (Micro Cap)
37.00
50
0.00%
0.28
2.28%
0.82
Total Returns (Price + Dividend) 
Latest dividend: 0.168327 per share ex-dividend date: Sep-21-2015
Risk Adjusted Returns v/s
Returns Beta

News

Hilton Metal Forging Ltd Locks at Upper Circuit With 3.8% Gain — Buyers Queue, Sellers Absent
At Rs 25.13, the buying was done — not because demand dried up, but because the exchange wouldn't let the stock go any higher. Hilton Metal Forging Ltd locked at its upper circuit of 3.8% on 17 Jul 2026, with buyers queuing and no sellers willing to part with shares.
Read full news article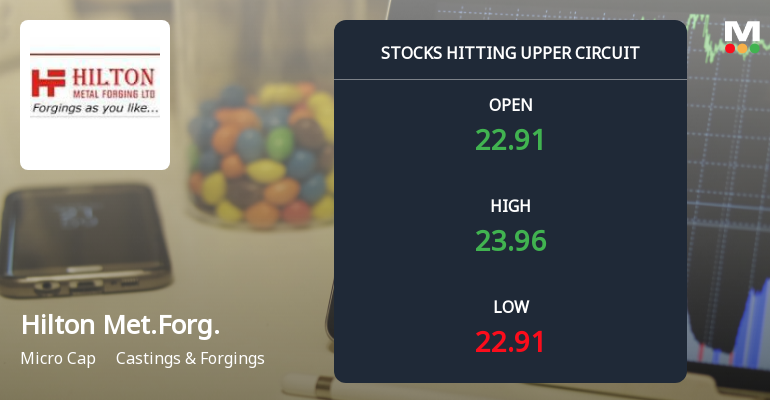
Hilton Metal Forging Ltd Locks at Upper Circuit With 5.0% Gain — Buyers Queue, Sellers Absent
At Rs 23.94, the buying was done — not because demand dried up, but because the exchange wouldn't let the stock go any higher. Hilton Metal Forging Ltd locked at its upper circuit of 5.0% on 15 Jul 2026, with buyers queuing and no sellers willing to part with shares.
Read full news article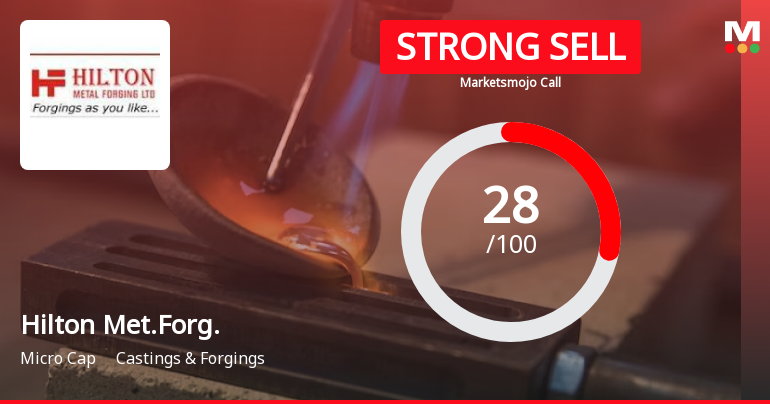
Hilton Metal Forging Ltd is Rated Strong Sell
Hilton Metal Forging Ltd is rated Strong Sell by MarketsMOJO, with this rating last updated on 17 June 2026. However, the analysis and financial metrics presented here reflect the stock’s current position as of 10 July 2026, providing investors with the most up-to-date view of the company’s fundamentals, returns, and technical outlook.
Read full news article Announcements
Closure of Trading Window
30-Jun-2026 | Source : BSEPlease find enclosed intimation
Notice Of EGM Dated 15Th July 2026
22-Jun-2026 | Source : BSEPlease find enclosed
Board Meeting Outcome for Outcome Of The Board Meeting Held On 18Th June 2026 By The Board Of Directors Of The Company.
18-Jun-2026 | Source : BSEOutcome of the Board Meeting held on 18th June 2026 by the Board of Directors of the company.
Corporate Actions

No Upcoming Board Meetings

Hilton Metal Forging Ltd has declared 2% dividend, ex-date: 21 Sep 15

No Splits history available

No Bonus history available

Hilton Metal Forging Ltd has announced 29:60 rights issue, ex-date: 24 Feb 26
Quality key factors
Valuation key factors
Technicals key factors
 Technical Indicator Scale: Bearish, Mildly Bearish, Sideways, Mildly Bullish, Bullish Turned
 Shareholding Snapshot : Apr 2026
Shareholding Compare (%holding)
Non Institution
None
Held by 0 Schemes
Held by 2 FIIs (0.1%)
Yuvraj Hiralal Malhotra (16.28%)
Puneet Jitendra Sejpal (2.41%)
70.8%
Quarterly Results Snapshot (Standalone) - Mar'26 - QoQ

QoQ Growth in quarter ended Mar 2026 is -27.21% vs -20.31% in Dec 2025
QoQ Growth in quarter ended Mar 2026 is -90.14% vs -18.39% in Dec 2025
Half Yearly Results Snapshot (Standalone) - Sep'25

Growth in half year ended Sep 2025 is 41.03% vs 24.45% in Sep 2024
Growth in half year ended Sep 2025 is 57.50% vs -70.22% in Sep 2024
Nine Monthly Results Snapshot (Standalone) - Dec'25
YoY Growth in nine months ended Dec 2025 is 52.05% vs 13.27% in Dec 2024
YoY Growth in nine months ended Dec 2025 is 100.61% vs -73.13% in Dec 2024
Annual Results Snapshot (Standalone) - Mar'26
YoY Growth in year ended Mar 2026 is 41.29% vs 18.09% in Mar 2025
YoY Growth in year ended Mar 2026 is -44.17% vs -7.62% in Mar 2025
About Hilton Metal Forging Ltd

Company Coordinates


