
Key Events This Week
25 May: Technical upgrade to Sell rating on improved indicators
27 May: Quarterly results reveal flat financial trend amid margin pressures
29 May: Stock closes the week at Rs.216.35, up 1.17% on the day
Jun 10, 03:30 PM
BSE+NSE Vol: 2.38 k
Auto Components & Equipments
INR 212 Cr (Micro Cap)
17.00
24
0.00%
0.69
5.58%
0.94
Latest dividend: 0.4 per share ex-dividend date: Sep-23-2024

25 May: Technical upgrade to Sell rating on improved indicators
27 May: Quarterly results reveal flat financial trend amid margin pressures
29 May: Stock closes the week at Rs.216.35, up 1.17% on the day
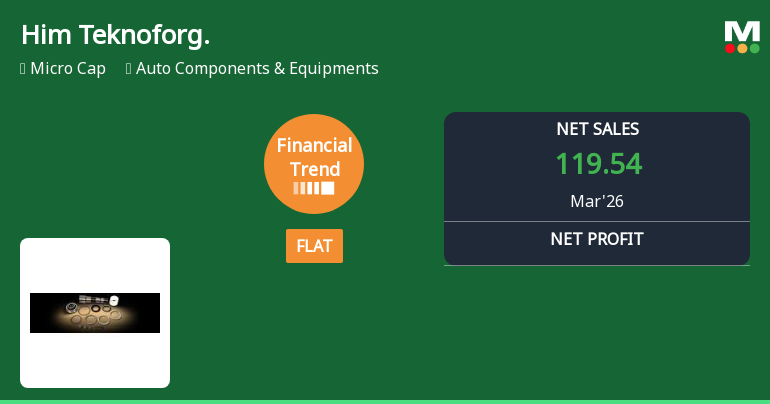
Him Teknoforge Ltd, a micro-cap player in the Auto Components & Equipments sector, has reported a flat financial trend for the quarter ended March 2026, signalling a pause in its recent growth momentum. Despite achieving record quarterly net sales, the company’s overall financial health shows signs of strain, with rising interest costs and declining earnings per share weighing on investor sentiment.
Read full news article
Recent Price Movement and Market Context
Him Teknoforge Ltd has demonstrated notable resilience and strength in its price performance over various time frames. In the past week, the stock surged by 5.39%, significantly outperforming the Sensex's modest 1.08% gain. Over the last month, the stock managed a slight positive return of 0.39%, while the Sensex declined by 0.85%. This relative outperformance is even more pronounced when viewed over the year-to-date period, where Him Teknoforge Ltd's loss of 0.66% is far less severe than the Sensex's 10.81% decline.
Longer-term returns further highlight the stock's robust growth trajectory. Over one year, the stock appreciated by 10.84%, contrasting with the Sensex's 7.50% loss. The three-year and five-year returns are particul...
Read full news articleWe attach herewith press release regarding Financial results for quarter/year ending 31.03.2026
We attach Annual secretarial compliance report for financial year ending 31.03.2026.
The Board of Directors of the Company at their meeting held on Tuesday the 26th day of May 2026 inter alia considered and approved following Agenda Items: 1. Audited Financial Results of the Company for the quarter and year ended on 31st March 2026. 2. Audit Report of the Statutory Auditors on the Audited Financial Results of the Company for the quarter and year ended on 31st March 2026. 3. Declaration in respect of unmodified opinion of the Statutory Auditor on the audited financial results for the quarter and year ended on 31st March 2026. 4. Re-Appointment of Internal Auditors.

No Upcoming Board Meetings

Him Teknoforge Ltd has declared 25% dividend, ex-date: 20 Aug 25

Him Teknoforge Ltd has announced 2:10 stock split, ex-date: 03 Mar 14

No Bonus history available

No Rights history available
 Technical Indicator Scale: Bearish, Mildly Bearish, Sideways, Mildly Bullish, Bullish Turned
 Promoters
43.656
Held by 0 Schemes
Held by 2 FIIs (0.27%)
Anju Aggarwal (8.36%)
Krish Automotive Sales And Services Private Limited (2.65%)
33.29%

QoQ Growth in quarter ended Mar 2026 is 10.09% vs 2.06% in Dec 2025
QoQ Growth in quarter ended Mar 2026 is 24.67% vs 4.47% in Dec 2025

Growth in half year ended Sep 2025 is -0.64% vs 7.59% in Sep 2024
Growth in half year ended Sep 2025 is 35.05% vs 48.61% in Sep 2024
YoY Growth in nine months ended Dec 2025 is 6.52% vs 7.96% in Dec 2024
YoY Growth in nine months ended Dec 2025 is 56.66% vs 64.62% in Dec 2024
YoY Growth in year ended Mar 2026 is 8.00% vs 7.91% in Mar 2025
YoY Growth in year ended Mar 2026 is 29.20% vs 37.27% in Mar 2025


