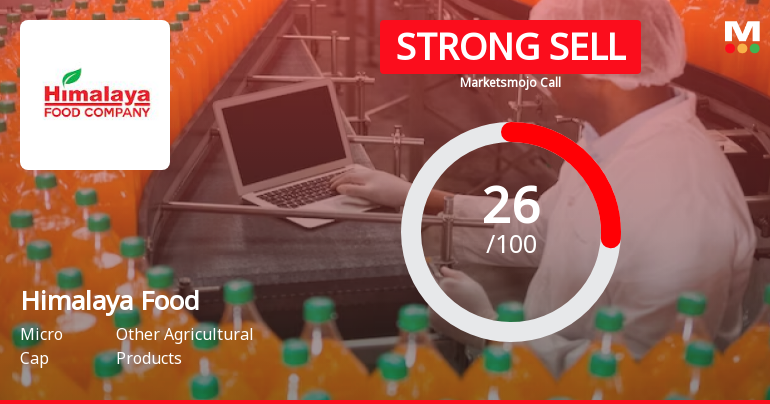
Himalaya Food

  • Market Cap: Micro Cap
  • Industry: Other Agricultural Products
  • ISIN: INE552B01010
  • NSEID:
  • BSEID: 526899
INR
8.22
0.03 (0.37%)
BSENSE

Sep 02, 10:05 AM

BSE+NSE Vol: 3.4 k

  • Price Points
  • Score
  • Mojo Parameters
  • Total Return
  • News and Corporate Actions
  • Key factors
  • Shareholding
  • Financials
  • CompanyCV
stock-summaryPrice Point
High/Low

1Day

52 Week

Valuation
Technical
Day's Volume

CASH

3.4 k (5.04%) Volume

Shareholding (Jun 2026)

FII

0.00%

Held by 0 FIIs

DII

0.01%

Held by 0 DIIs

Promoter

48.94%

Why is Himalaya Food International Ltd falling/rising?

02-Sep-2026

As of 01-Sep, the stock price of Himalaya Food International Ltd is at 8.19, reflecting a 2.38% decline. The stock has consistently underperformed, with significant drops over various periods and is trading below all moving averages, indicating a persistent downward trend.

As of 01-Sep, the stock price of Himalaya Food International Ltd is falling, currently at 8.19, which reflects a decrease of 0.2 or 2.38%. This decline is evident in the stock's performance over various periods, showing a 1-week drop of 1.44%, a 1-month decline of 8.29%, and a year-to-date decrease of 15.91%. Over the past year, the stock has fallen by 39.51%, significantly underperforming compared to the Sensex, which has only decreased by 4.26% in the same timeframe.<BR><BR>Additionally, the stock is trading below its moving averages across all time frames, including the 5-day, 20-day, 50-day, 100-day, and 200-day averages, indicating a persistent downward trend. Investor participation has also decreased, with delivery volume dropping by 17.37% compared to the 5-day average, suggesting reduced interest in the stock. Overall, these factors contribute to the stock's current downward trajectory.

View full answer

Who are in the management team of Himalaya Food?

01-Sep-2026

The management team of Himalaya Food includes Man Mohan Malik (Chairman/Executive Director), Sangita Malik (Executive Director & Wholetime Director), Sanjiv Kumar Kakkar (Executive Director), Sunil Khera (Independent Non-Executive Director), Neelam Khanna (Independent Non-Executive Director), and Siddharth Panwar (Company Secretary & Compliance Officer).

The management team of Himalaya Food includes the following individuals:<BR><BR>1. **Man Mohan Malik** - Chairman / Executive Director<BR>2. **Sangita Malik** - Executive Director & Wholetime Director<BR>3. **Sanjiv Kumar Kakkar** - Executive Director<BR>4. **Sunil Khera** - Independent Non-Executive Director<BR>5. **Neelam Khanna** - Independent Non-Executive Director<BR>6. **Siddharth Panwar** - Company Secretary & Compliance Officer<BR><BR>If you need more information about any specific member or their roles, feel free to ask!

View full answer

What does Himalaya Food do?

01-Sep-2026

Himalaya Food International Ltd is a micro-cap company that processes mushrooms, baby potatoes, and buffalo cheese. As of June 2026, it reported net sales of 9 Cr and a net profit of 1 Cr, with a market cap of INR 71 Cr.

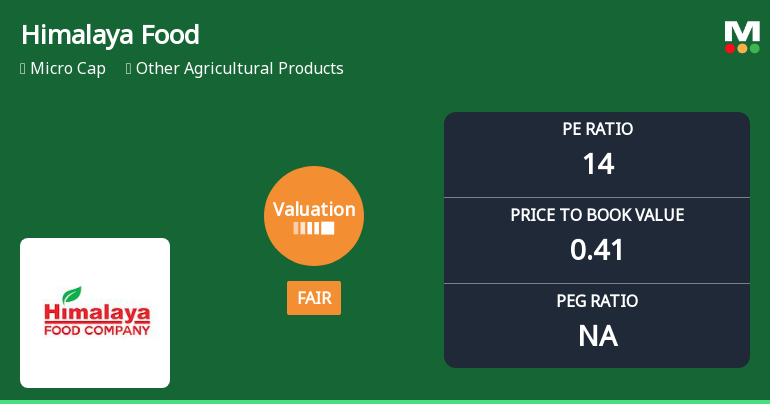
Overview: <BR>Himalaya Food International Ltd is a micro-cap company in the Other Agricultural Products industry, primarily engaged in processing mushrooms, baby potatoes, and buffalo cheese.<BR><BR>History: <BR>Incorporated in 1992, Himalaya Food International Ltd has been involved in the manufacture of various food products. The latest quarterly results reported net sales and net profit for June 2026.<BR><BR>Financial Snapshot: <BR>Most recent Net Sales: 9 Cr (Quarterly Results - Jun 2026) <BR>Most recent Net Profit: 1 Cr (Quarterly Results - Jun 2026) <BR>Market-cap value: INR 71 Cr (Micro Cap)<BR><BR>Key Metrics: <BR>P/E: 14.00 <BR>Industry P/E: 44 <BR>Dividend Yield: 0.00% <BR>Debt Equity: -0.01 <BR>Return on Equity: 1.25% <BR>Price to Book: 0.41 <BR><BR>Contact Details: <BR>Address: 118 1st Floor Rajendra Place, 12 Gagandeep Building New Delhi New Delhi : 110008 <BR>Website: http://www.himalayafoodcompany.com

View full answer

Who are the peers of the Himalaya Food?

01-Sep-2026

Himalaya Food's peers include Naturite Agro, Saptarishi Agro, Universal Starch, Agri-Tech India, City Crops Agro, Indrayani Biotec, Flex Foods, and Upsurge Seeds. In terms of returns, Universal Starch leads at 13.45%, while Himalaya Food's return is -38.67%.

Peers: The peers of Himalaya Food are Naturite Agro, Saptarishi Agro, Universal Starch, Agri-Tech India, City Crops Agro, Indrayani Biotec, Flex Foods, and Upsurge Seeds.<BR><BR>Quality Snapshot: Below Average management risk is observed at Naturite Agro, Himalaya Food, City Crops Agro, Indrayani Biotec, and Upsurge Seeds, while Average management risk is found at Saptarishi Agro, Universal Starch, and Flex Foods. Agri-Tech India does not qualify for management risk assessment. Below Average growth is noted at Naturite Agro, Saptarishi Agro, Universal Starch, Himalaya Food, and Flex Foods, while Good growth is observed at Indrayani Biotec and Upsurge Seeds. Agri-Tech India does not qualify for growth assessment. Below Average capital structure is seen at Naturite Agro, Saptarishi Agro, Universal Starch, Himalaya Food, City Crops Agro, and Indrayani Biotec, while Average capital structure is noted at Flex Foods. Agri-Tech India does not qualify for capital structure assessment.<BR><BR>Return Snapshot: The peer with the highest 1-year return is Universal Starch at 13.45%, while the peer with the lowest is Naturite Agro at -44.25%. Himalaya Food's 1-year return of -38.67% is better than Naturite Agro's but worse than Universal Starch's. Additionally, the six-month return is negative for Naturite Agro, Saptarishi Agro, and Indrayani Biotec.

View full answer

How big is Himalaya Food?

01-Sep-2026

As of 31st August, Himalaya Food International Ltd has a market capitalization of 71.00 Cr, with recent net sales of 47.15 Cr and a net profit of 5.22 Cr. Shareholder's funds are valued at 137.95 Cr, and total assets amount to 208.06 Cr.

As of 31st August, Himalaya Food International Ltd has a market capitalization of 71.00 Cr, categorizing it as a Micro Cap company.<BR><BR>In the latest four quarters, the company reported Net Sales of 47.15 Cr and a Net Profit of 5.22 Cr.<BR><BR>For the latest annual period ending in March 2024, Shareholder's Funds were valued at 137.95 Cr, while Total Assets amounted to 208.06 Cr.

View full answer

Should I buy, sell or hold Himalaya Food International Ltd?

16-Aug-2026

When is the next results date for Himalaya Food International Ltd?

11-Aug-2026

The next results date for Himalaya Food International Ltd is 14 August 2026.

The next results date for Himalaya Food International Ltd is scheduled for 14 August 2026.

View full answer

How has been the historical performance of Himalaya Food?

17-Nov-2025

Himalaya Food's historical performance has shown significant fluctuations, with net sales declining from 68.37 Cr in March 2023 to 47.19 Cr in March 2024, but profitability metrics improved, with profit after tax recovering to 4.90 Cr from a loss of 24.20 Cr the previous year. Despite challenges in sales and negative cash flow, the company demonstrated a recovery in operating profit and earnings per share.

Answer:<BR>The historical performance of Himalaya Food shows significant fluctuations over the years, particularly in net sales and profitability.<BR><BR>Breakdown:<BR>In the fiscal year ending March 2024, Himalaya Food reported net sales of 47.19 Cr, a decline from 68.37 Cr in March 2023 and 62.59 Cr in March 2022. The total operating income mirrored this trend, remaining at 47.19 Cr in March 2024, down from 68.37 Cr in the previous year. The company's total expenditure, excluding depreciation, also decreased to 35.99 Cr from 115.08 Cr in March 2023. Operating profit, excluding other income, improved to 11.20 Cr in March 2024, recovering from a loss of 46.71 Cr in March 2023, while profit before tax turned positive at 4.24 Cr compared to a loss of 24.71 Cr the previous year. Consequently, profit after tax reached 4.90 Cr in March 2024, a notable recovery from a loss of 24.20 Cr in March 2023. The earnings per share (EPS) also reflected this recovery, rising to 0.78 from -3.84. On the balance sheet, total assets decreased to 208.06 Cr in March 2024 from 223.04 Cr in March 2023, with total liabilities also declining to 208.06 Cr. The cash flow from operating activities was negative at -2.00 Cr, contrasting with a positive flow of 6.00 Cr in March 2023. Overall, while the company faced challenges in sales and cash flow, it showed signs of recovery in profitability metrics in March 2024.

View full answer

Are Himalaya Food latest results good or bad?

14-Aug-2025

Himalaya Food's latest results show strong growth in profitability, with a 96.2% increase in Profit Before Tax and a 57.1% rise in Profit After Tax. However, a significant 45.91% decline in Net Sales and low Operating Cash Flow raise concerns, leading MarketsMOJO to issue a 'Sell' recommendation for the stock.

Himalaya Food International's latest results for the quarter ending September 2024 indicate a mixed performance. On the positive side, the company has shown significant growth in key financial metrics, with Profit Before Tax (PBT) increasing by 96.2% and Profit After Tax (PAT) rising by 57.1% compared to the previous four quarters. Additionally, the Operating Profit for the quarter was the highest in the last five quarters, and the Operating Profit Margin improved to 30.33%, also a five-quarter high. This reflects a positive trend in profitability and operational efficiency.<BR><BR>However, there are concerning aspects as well. The company experienced a substantial decline in Net Sales, down by 45.91% year on year for the nine-month period, which raises concerns about its revenue generation capabilities. Furthermore, the Operating Cash Flow has reached its lowest point in three years, indicating challenges in cash revenues from business operations.<BR><BR>Overall, while Himalaya Food has demonstrated positive growth in certain areas, the significant drop in sales and cash flow issues suggest that the company needs to address these challenges to ensure sustainable growth moving forward. Given these mixed results, MarketsMOJO has issued a 'Sell' call for the stock, reflecting caution in light of the declining sales and cash flow.

View full answer

Is Himalaya Food overvalued or undervalued?

07-Aug-2025

As of August 6, 2025, Himalaya Food is considered undervalued with a valuation grade of very attractive, featuring a PE ratio of 22.19, an EV to EBITDA of 10.55, and a Price to Book Value of 0.84, making it more favorable compared to peers like Hindustan Unilever and Nestle India, despite a year-to-date stock decline of 27.61% against a 3.08% gain for the Sensex.

As of 6 August 2025, the valuation grade for Himalaya Food has moved from fair to very attractive, indicating a significant improvement in its perceived value. The company is currently considered undervalued. Key ratios include a PE ratio of 22.19, an EV to EBITDA of 10.55, and a Price to Book Value of 0.84, which suggest that the stock is trading at a lower valuation compared to its earnings and assets.<BR><BR>In comparison to its peers, Himalaya Food's valuation metrics are notably more favorable. For instance, Hindustan Unilever has a PE ratio of 55.95, while Nestle India stands at 71.69, both indicating they are very expensive relative to Himalaya Food. Despite recent underperformance in stock returns compared to the Sensex, with a year-to-date decline of 27.61% against a 3.08% gain for the index, the company's current valuation suggests it may present a compelling investment opportunity.

View full answer

Who are the top shareholders of the Himalaya Food?

17-Jul-2025

The top shareholder of Himalaya Food is Arjun Malik, holding 8.49%, while individual investors collectively own 44.8%. Bennett, Coleman And Company Limited is the largest public shareholder at 1.22%, with no mutual funds or foreign institutional investors involved.

The top shareholders of Himalaya Food include Arjun Malik, who is the promoter with the highest holding at 8.49%. The company has a significant portion of its shares held by individual investors, accounting for 44.8% of the total. Additionally, Bennett, Coleman And Company Limited is the highest public shareholder, holding 1.22%. Notably, there are no mutual funds or foreign institutional investors currently holding shares in the company.

View full answer

What is the technical trend for Himalaya Food?

09-Jun-2025

As of April 16, 2025, Himalaya Food's technical trend is mildly bearish, with mixed signals from various indicators showing a shift from bearish to mildly bullish on weekly charts, while underperforming against the Sensex over the past 1 to 3 years.

As of 16 April 2025, the technical trend for Himalaya Food has changed from bearish to mildly bearish. The weekly MACD and Bollinger Bands indicate a mildly bullish stance, while the monthly indicators remain bearish. The daily moving averages are mildly bearish, and the Dow Theory shows a mildly bearish trend on the weekly chart with no trend on the monthly chart. The stock has underperformed significantly against the Sensex over various time frames, particularly in the 1Y and 3Y periods. Overall, the current technical stance is mildly bearish, reflecting mixed signals across different time frames.

View full answer

Has Himalaya Food declared dividend?

06-Jun-2025

No Dividend History Available

iScoreScore
Click here to find our call on this stock
Strong Sell
Sell
Hold
Buy
Strong Buy

Dashboard

1

Weak Long Term Fundamental Strength with a -11.95% CAGR growth in Operating Profits over the last 5 years

  • Company's ability to service its debt is weak with a poor EBIT to Interest (avg) ratio of 0.26
  • The company has been able to generate a Return on Equity (avg) of 5.38% signifying low profitability per unit of shareholders funds
2

Flat results in Jun 26

3

Consistent Underperformance against the benchmark over the last 3 years

stock-summaryMojo Parameters

Mojo Parameters

Loading Valuation Snapshot...

Stock DNA

stock-summary
Industry

Other Agricultural Products

stock-summary
Market cap

INR 70 Cr (Micro Cap)

stock-summary
P/E

13.00

stock-summary
Industry P/E

44

stock-summary
Dividend Yield

0.00%

stock-summary
Debt Equity

-0.01

stock-summary
Return on Equity

1.25%

stock-summary
Price to Book

0.41

Revenue and Profits:
Net Sales:
9 Cr
(Quarterly Results - Jun 2026)
Net Profit:
1 Cr
stock-summaryTotal Returns
Total Returns (Price + Dividend) stock-summary
Dividend Yield (0%)
TimePeriod
Price Return
Dividend Return
Total Return
3 Months
-17.72%
0%
-17.72%
6 Months
-8.16%
0%
-8.16%
1 Year
-39.65%
0%
-39.65%
2 Years
-59.06%
0%
-59.06%
3 Years
-60.88%
0%
-60.88%
4 Years
-57.72%
0%
-57.72%
5 Years
-43.23%
0%
-43.23%

Himalaya Food for the last several years.

Risk Adjusted Returns v/s stock-summary
Returns Beta
Icon
Beta has not been calculated since enough price history is not available
stock-summaryNews & Corporate Actions

Announcements stock-summary

Board Meeting Outcome for Outcomes Of The Board Meeting Regulation 30 Of The Securities And Exchange Board Of India (Listing Obligations And Disclosure Requirement) Regulations 2015

27-Aug-2026 | Source : BSE

Outcomes of the Board Meeting Regulation 30 of the Securities and Exchange Board of India (Listing Obligations and Disclosure Requirement) Regulations 2015

Board Meeting Intimation for Intimation Of Board Meeting Pursuant To Regulation 29 Of SEBI (Listing Obligation And Disclosure Requirements) Regulations 2015.

22-Aug-2026 | Source : BSE

Himalaya Food International Ltdhas informed BSE that the meeting of the Board of Directors of the Company is scheduled on 27/08/2026 inter alia to consider and approve To Consider And Approve The Acquisition Of Business Undertaking Plant Machinery Industrial Land Building And Cold Storage Assets Of Doon Valley Foods Private Limited And The Proposed Settlement Of Historical Operational Liabilities

Announcement under Regulation 30 (LODR)-Newspaper Publication

15-Aug-2026 | Source : BSE

Submission of the copies of the newspaper advertisement of Un-Audited Financial Results for the quarter ended for June 30th 2026

Corporate Actions stock-summary

stock-summary
BOARD MEETING

No Upcoming Board Meetings

stock-summary
DIVIDEND

No Dividend history available

stock-summary
SPLITS

No Splits history available

stock-summary
BONUS

No Bonus history available

stock-summary
RIGHTS

Himalaya Food International Ltd has announced 1:2 rights issue, ex-date: 23 May 25

stock-summaryKey Factors

Quality key factors stock-summary

Factor
Value
Sales Growth (5y)
-8.63%
EBIT Growth (5y)
-11.95%
EBIT to Interest (avg)
0.26
Debt to EBITDA (avg)
12.37
Net Debt to Equity (avg)
-0.01
Sales to Capital Employed (avg)
0.40
Tax Ratio
Tax Ratio is Negative%
Dividend Payout Ratio
0
Pledged Shares
15.66%
Institutional Holding
0.01%
ROCE (avg)
-1.03%
ROE (avg)
5.38%

Valuation key factors

Factor
Value
P/E Ratio
13
Industry P/E
44
Price to Book Value
0.41
EV to EBIT
47.62
EV to EBITDA
9.00
EV to Capital Employed
0.40
EV to Sales
1.81
PEG Ratio
NA
Dividend Yield
NA
ROCE (Latest)
1.74%
ROE (Latest)
1.25%

Technicals key factors

Indicator
Weekly
Monthly
MACD
Bearish
Mildly Bullish
RSI
Bullish
No Signal
Bollinger Bands
Bearish
Bearish
Moving Averages
Bearish (Daily)
KST
Bearish
Mildly Bullish
Dow Theory
Mildly Bullish
No Trend
stock-summary Technical Indicator Scale: Bearish, Mildly Bearish, Sideways, Mildly Bullish, Bullish  Turned 
stock-summaryShareholding
Shareholding Snapshot : Jun 2026stock-summary
Shareholding Compare (%holding) stock-summary
Majority shareholders

Non Institution

Pledged Promoter Holdings

15.663

Mutual Funds

Held by 0 Schemes

FIIs

Held by 0 FIIs

Promoter with highest holding

M/s Doon Valley Foods (p) Ltd (18.09%)

Highest Public shareholder

None

Individual Investors Holdings

42.31%

stock-summaryFinancial
[
  {
    "link": "quarterly",
    "btn_text": "All Quarterly Results",
    "header": "Quarterly Results Snapshot (Standalone) - Jun'26 - QoQ",
    "rhs": [
      {
        "prefix": "Net Sales ",
        "suffix": "QoQ Growth in quarter ended Jun 2026 is 3.44% vs -15.18% in Mar 2026",
        "dir": 1
      },
      {
        "prefix": "Standalone Net Profit ",
        "suffix": "QoQ Growth in quarter ended Jun 2026 is 143.51% vs -406.41% in Mar 2026",
        "dir": 1
      }
    ],
    "table": {
      "header": [
        "Jun'26",
        "Mar'26",
        "Change(%)"
      ],
      "body": [
        {
          "field": "Net Sales",
          "val1": "8.73",
          "val2": "8.44",
          "chgp": "3.44%",
          "chgp_class": "positive"
        },
        {
          "field": "Operating Profit (PBDIT) excl Other Income",
          "val1": "2.51",
          "val2": "-1.52",
          "chgp": "265.13%",
          "chgp_class": "positive"
        },
        {
          "field": "Interest",
          "val1": "0.01",
          "val2": "0.11",
          "chgp": "-90.91%",
          "chgp_class": "positive"
        },
        {
          "field": "Exceptional Items",
          "val1": "0.00",
          "val2": "0.00",
          "chgp": "",
          "chgp_class": "neutral"
        },
        {
          "field": "Standalone Net Profit",
          "val1": "1.04",
          "val2": "-2.39",
          "chgp": "143.51%",
          "chgp_class": "positive"
        },
        {
          "field": "Operating Profit Margin (Excl OI)",
          "val1": "28.75%",
          "val2": "-18.01%",
          "chgp": "46.76%",
          "chgp_class": "positive"
        }
      ]
    }
  },
  {
    "link": "half-yearly",
    "btn_text": "All Half Yearly Results",
    "header": "Half Yearly Results Snapshot (Standalone) - Sep'25",
    "rhs": [
      {
        "prefix": "Net Sales ",
        "suffix": " Growth in half year ended Sep 2025 is -2.97% vs 14.23% in Sep 2024",
        "dir": -1
      },
      {
        "prefix": "Standalone Net Profit ",
        "suffix": " Growth in half year ended Sep 2025 is 81.23% vs 86.62% in Sep 2024",
        "dir": -1
      }
    ],
    "table": {
      "header": [
        "Sep'25",
        "Sep'24",
        "Change(%)"
      ],
      "body": [
        {
          "field": "Net Sales",
          "val1": "21.27",
          "val2": "21.92",
          "chgp": "-2.97%",
          "chgp_class": "negative"
        },
        {
          "field": "Operating Profit (PBDIT) excl Other Income",
          "val1": "8.40",
          "val2": "5.68",
          "chgp": "47.89%",
          "chgp_class": "positive"
        },
        {
          "field": "Interest",
          "val1": "0.02",
          "val2": "0.03",
          "chgp": "-33.33%",
          "chgp_class": "positive"
        },
        {
          "field": "Exceptional Items",
          "val1": "0.00",
          "val2": "0.00",
          "chgp": "",
          "chgp_class": "neutral"
        },
        {
          "field": "Standalone Net Profit",
          "val1": "5.31",
          "val2": "2.93",
          "chgp": "81.23%",
          "chgp_class": "positive"
        },
        {
          "field": "Operating Profit Margin (Excl OI)",
          "val1": "39.49%",
          "val2": "25.91%",
          "chgp": "13.58%",
          "chgp_class": "positive"
        }
      ]
    }
  },
  {
    "link": "nine-monthly",
    "btn_text": "All Nine Monthly Results",
    "header": "Nine Monthly Results Snapshot (Standalone) - Dec'25",
    "rhs": [
      {
        "prefix": "Net Sales ",
        "suffix": "YoY Growth in nine months ended Dec 2025 is -0.79% vs -2.15% in Dec 2024",
        "dir": 1
      },
      {
        "prefix": "Standalone Net Profit ",
        "suffix": "YoY Growth in nine months ended Dec 2025 is 104.36% vs -1.00% in Dec 2024",
        "dir": 1
      }
    ],
    "table": {
      "header": [
        "Dec'25",
        "Dec'24",
        "Change(%)"
      ],
      "body": [
        {
          "field": "Net Sales",
          "val1": "31.22",
          "val2": "31.47",
          "chgp": "-0.79%",
          "chgp_class": "negative"
        },
        {
          "field": "Operating Profit (PBDIT) excl Other Income",
          "val1": "10.77",
          "val2": "7.15",
          "chgp": "50.63%",
          "chgp_class": "positive"
        },
        {
          "field": "Interest",
          "val1": "0.03",
          "val2": "0.04",
          "chgp": "-25.00%",
          "chgp_class": "positive"
        },
        {
          "field": "Exceptional Items",
          "val1": "0.00",
          "val2": "0.00",
          "chgp": "",
          "chgp_class": "neutral"
        },
        {
          "field": "Standalone Net Profit",
          "val1": "6.09",
          "val2": "2.98",
          "chgp": "104.36%",
          "chgp_class": "positive"
        },
        {
          "field": "Operating Profit Margin (Excl OI)",
          "val1": "34.39%",
          "val2": "22.46%",
          "chgp": "11.93%",
          "chgp_class": "positive"
        }
      ]
    }
  },
  {
    "link": "annual",
    "btn_text": "All Annual Results",
    "header": "Annual Results Snapshot (Standalone) - Mar'26",
    "rhs": [
      {
        "prefix": "Net Sales ",
        "suffix": "YoY Growth in year ended Mar 2026 is -1.35% vs -9.44% in Mar 2025",
        "dir": 1
      },
      {
        "prefix": "Standalone Net Profit ",
        "suffix": "YoY Growth in year ended Mar 2026 is -4.87% vs -20.41% in Mar 2025",
        "dir": 1
      }
    ],
    "table": {
      "header": [
        "Mar'26",
        "Mar'25",
        "Change(%)"
      ],
      "body": [
        {
          "field": "Net Sales",
          "val1": "39.54",
          "val2": "40.08",
          "chgp": "-1.35%",
          "chgp_class": "negative"
        },
        {
          "field": "Operating Profit (PBDIT) excl Other Income",
          "val1": "9.04",
          "val2": "8.87",
          "chgp": "1.92%",
          "chgp_class": "positive"
        },
        {
          "field": "Interest",
          "val1": "0.14",
          "val2": "0.04",
          "chgp": "250.00%",
          "chgp_class": "negative"
        },
        {
          "field": "Exceptional Items",
          "val1": "0.00",
          "val2": "0.00",
          "chgp": "",
          "chgp_class": "neutral"
        },
        {
          "field": "Standalone Net Profit",
          "val1": "3.71",
          "val2": "3.90",
          "chgp": "-4.87%",
          "chgp_class": "negative"
        },
        {
          "field": "Operating Profit Margin (Excl OI)",
          "val1": "22.86%",
          "val2": "22.13%",
          "chgp": "0.73%",
          "chgp_class": "positive"
        }
      ]
    }
  }
]

Quarterly Results Snapshot (Standalone) - Jun'26 - QoQstock-summary

Jun'26
Mar'26
Change(%)
Net Sales
8.73
8.44
3.44%
Operating Profit (PBDIT) excl Other Income
2.51
-1.52
265.13%
Interest
0.01
0.11
-90.91%
Exceptional Items
0.00
0.00
Standalone Net Profit
1.04
-2.39
143.51%
Operating Profit Margin (Excl OI)
28.75%
-18.01%
46.76%
Values in Rs Cr.
Direction Arrows
Net Sales

QoQ Growth in quarter ended Jun 2026 is 3.44% vs -15.18% in Mar 2026

Direction Arrows
Standalone Net Profit

QoQ Growth in quarter ended Jun 2026 is 143.51% vs -406.41% in Mar 2026

Half Yearly Results Snapshot (Standalone) - Sep'25stock-summary

Sep'25
Sep'24
Change(%)
Net Sales
21.27
21.92
-2.97%
Operating Profit (PBDIT) excl Other Income
8.40
5.68
47.89%
Interest
0.02
0.03
-33.33%
Exceptional Items
0.00
0.00
Standalone Net Profit
5.31
2.93
81.23%
Operating Profit Margin (Excl OI)
39.49%
25.91%
13.58%
Values in Rs Cr.
Direction Arrows
Net Sales

Growth in half year ended Sep 2025 is -2.97% vs 14.23% in Sep 2024

Direction Arrows
Standalone Net Profit

Growth in half year ended Sep 2025 is 81.23% vs 86.62% in Sep 2024

Nine Monthly Results Snapshot (Standalone) - Dec'25stock-summary

Dec'25
Dec'24
Change(%)
Net Sales
31.22
31.47
-0.79%
Operating Profit (PBDIT) excl Other Income
10.77
7.15
50.63%
Interest
0.03
0.04
-25.00%
Exceptional Items
0.00
0.00
Standalone Net Profit
6.09
2.98
104.36%
Operating Profit Margin (Excl OI)
34.39%
22.46%
11.93%
Values in Rs Cr.
Direction Arrows
Net Sales

YoY Growth in nine months ended Dec 2025 is -0.79% vs -2.15% in Dec 2024

Direction Arrows
Standalone Net Profit

YoY Growth in nine months ended Dec 2025 is 104.36% vs -1.00% in Dec 2024

Annual Results Snapshot (Standalone) - Mar'26stock-summary

Mar'26
Mar'25
Change(%)
Net Sales
39.54
40.08
-1.35%
Operating Profit (PBDIT) excl Other Income
9.04
8.87
1.92%
Interest
0.14
0.04
250.00%
Exceptional Items
0.00
0.00
Standalone Net Profit
3.71
3.90
-4.87%
Operating Profit Margin (Excl OI)
22.86%
22.13%
0.73%
Values in Rs Cr.
Direction Arrows
Net Sales

YoY Growth in year ended Mar 2026 is -1.35% vs -9.44% in Mar 2025

Direction Arrows
Standalone Net Profit

YoY Growth in year ended Mar 2026 is -4.87% vs -20.41% in Mar 2025

stock-summaryCompany CV
About Himalaya Food International Ltd stock-summary
stock-summary
Himalaya Food International Ltd
Micro Cap
Other Agricultural Products
Himalaya International Limited, an India-based frozen food company, is engaged in processing mushrooms, baby potatoes and buffalo cheese. Incorporated in 1992, the Company's primary business is manufacture of Mushroom, vegetables. Cheese, Yogurt, Appetizers, snacks, sweets and French fries and trading of daily one tablet etc. It offers 3 varieties of Mushrooms: White (Agaricus), Crimini (Italian Brown) and Portobello. It is also engaged in processing of vegetables and baby potatoes.
Company Coordinates stock-summary
Company Details
118 1st Floor Rajendra Place, 12 Gagandeep Building New Delhi New Delhi : 110008
Registrar Details
Beetal Financial & Computer Services (P) Ltd , Beetal House , 99 Mandangir, 3rd Floor, Behind Local Shopping Centre, Near Dada Harsukhdas Mandir, New Delhi