
 Price Point
Compare Hind Aluminium with Similar Stocks
ScoreDashboard
Weak Long Term Fundamental Strength with a -33.40% CAGR growth in Net Sales over the last 5 years
- Company's ability to service its debt is weak with a poor EBIT to Interest (avg) ratio of -8.57
- The company has been able to generate a Return on Equity (avg) of 9.85% signifying low profitability per unit of shareholders funds
Risky - Negative EBITDA


 Total Returns
Total Returns (Price + Dividend) 

Risk Adjusted Returns v/s
Returns Beta
News & Corporate ActionsNews
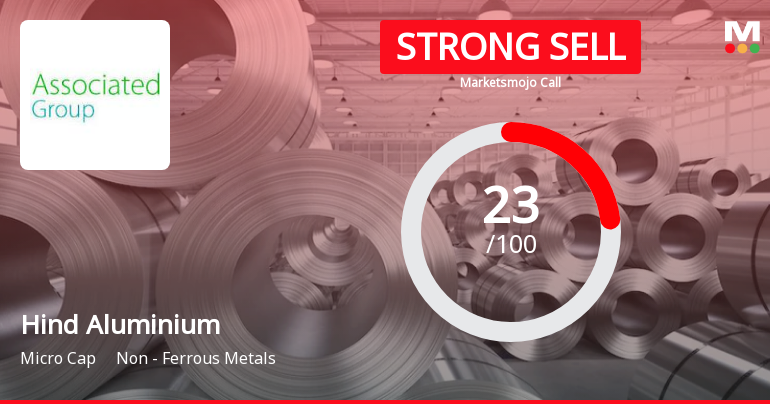
Hind Aluminium Industries Ltd Downgraded to Strong Sell Amid Technical and Fundamental Concerns
Hind Aluminium Industries Ltd has seen its investment rating downgraded from Sell to Strong Sell as of 11 Sep 2026, reflecting deteriorating technical indicators and persistent fundamental challenges. Despite some recent positive quarterly financial results, the company’s long-term outlook remains weak, driven by declining sales, poor debt servicing ability, and negative earnings before interest, taxes, depreciation and amortisation (EBITDA).
Read full news article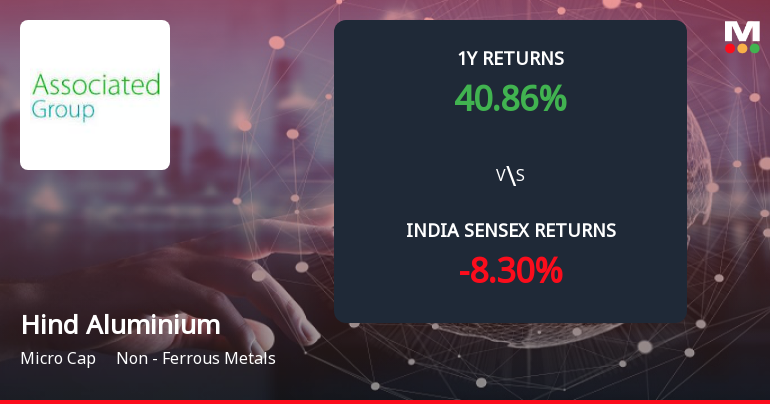
Hind Aluminium Industries Ltd Forms Death Cross Signalling Bearish Trend
Hind Aluminium Industries Ltd has recently formed a Death Cross, a significant technical indicator where the 50-day moving average crosses below the 200-day moving average. This development signals a potential shift towards a bearish trend, reflecting deteriorating momentum and raising concerns about the stock's medium to long-term outlook within the Non - Ferrous Metals sector.
Read full news article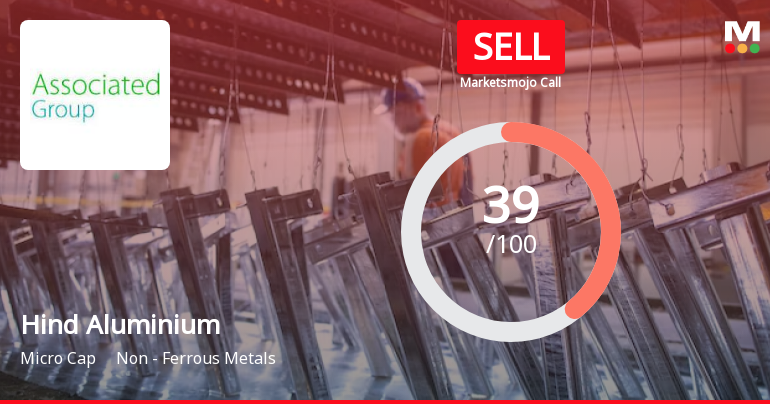
Hind Aluminium Industries Ltd is Rated Sell
Hind Aluminium Industries Ltd is rated 'Sell' by MarketsMOJO, with this rating last updated on 13 August 2026. However, the analysis and financial metrics discussed here reflect the stock's current position as of 04 September 2026, providing investors with an up-to-date perspective on the company’s fundamentals, valuation, financial trends, and technical outlook.
Read full news article Announcements
Corporate Actions

No Upcoming Board Meetings

Hind Aluminium Industries Ltd has declared 5% dividend, ex-date: 04 Sep 19

No Splits history available

No Bonus history available

No Rights history available
Key FactorsQuality key factors
Valuation key factors
Technicals key factors
 Technical Indicator Scale: Bearish, Mildly Bearish, Sideways, Mildly Bullish, Bullish Turned Shareholding
Shareholding Snapshot : Jun 2026
Shareholding Compare (%holding)
Promoters
None
Held by 0 Schemes
Held by 0 FIIs
Raghav Daga (15.28%)
Four Dimensions Securities (india) Ltd (2.7%)
26.52%
FinancialQuarterly Results Snapshot (Consolidated) - Jun'26 - QoQ
 Compare with Peers
QoQ Growth in quarter ended Jun 2026 is 354.24% vs -49.79% in Mar 2026

QoQ Growth in quarter ended Jun 2026 is 83.65% vs 3,566.67% in Mar 2026

Half Yearly Results Snapshot (Consolidated) - Sep'25
Growth in half year ended Sep 2025 is 503.28% vs -29.07% in Sep 2024
Growth in half year ended Sep 2025 is 37.13% vs -63.89% in Sep 2024
Nine Monthly Results Snapshot (Consolidated) - Dec'25
YoY Growth in nine months ended Dec 2025 is 601.16% vs -14.00% in Dec 2024
YoY Growth in nine months ended Dec 2025 is 77.86% vs -83.21% in Dec 2024
Annual Results Snapshot (Consolidated) - Mar'26
YoY Growth in year ended Mar 2026 is 134.85% vs 130.83% in Mar 2025
YoY Growth in year ended Mar 2026 is -23.28% vs -53.50% in Mar 2025
 Company CV
About Hind Aluminium Industries Ltd










