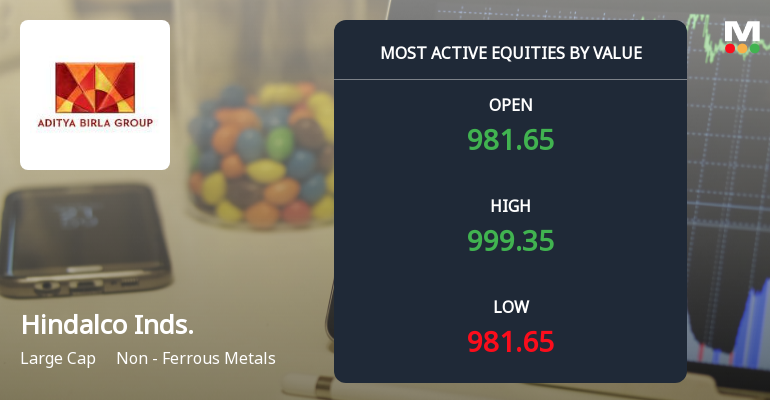
Hindalco Inds.

  • Market Cap: Large Cap
  • Industry: Non - Ferrous Metals
  • ISIN: INE038A01020
  • NSEID: HINDALCO
  • BSEID: 500440
INR
972.00
-11.8 (-1.2%)
BSENSE

Sep 18, 03:30 PM

BSE+NSE Vol: 86.05 lacs

  • Price Points
  • Score
  • Mojo Parameters
  • Total Return
  • News and Corporate Actions
  • Key factors
  • Shareholding
  • Financials
  • CompanyCV
stock-summaryPrice Point
High/Low

1Day

52 Week

Valuation
Technical
Day's Volume

CASH

86.05 lacs (93.26%) Volume

Shareholding (Jun 2026)

FII

31.42%

Held by 1117 FIIs

DII

24.35%

Held by 169 DIIs

Promoter

34.66%

Why is Hindalco Industries Ltd falling/rising?

06-Sep-2026

As of 05-Sep, Hindalco Industries Ltd's stock price is 1,013.80, down 0.22%. This decline is due to recent negative performance and decreased investor participation, despite the company's strong long-term growth metrics and solid financial health.

As of 05-Sep, Hindalco Industries Ltd's stock price is currently at 1,013.80, reflecting a decrease of 2.2 points or 0.22%. This decline can be attributed to several factors. Firstly, the stock has experienced a negative performance over the past week, with a drop of 2.23%, although it has outperformed the benchmark Sensex, which fell by 0.97% during the same period. <BR><BR>Additionally, there has been a notable decrease in investor participation, as evidenced by a significant drop in delivery volume, which fell by 61.26% compared to the 5-day average. This reduced trading activity may indicate a lack of confidence among investors, contributing to the stock's downward movement.<BR><BR>Despite these short-term challenges, it is important to note that Hindalco has shown strong long-term growth metrics, including a year-to-date return of 14.39% and a remarkable 37.23% return over the past year. The company's financial health is also solid, with a low debt-to-equity ratio of 0.45 and impressive growth in net profit and sales. However, the current market sentiment appears to be overshadowing these positive fundamentals, leading to the observed decline in stock price.

View full answer

Who are in the management team of Hindalco Inds.?

01-Sep-2026

The management team of Hindalco Industries includes Kumar Mangalam Birla (Chairman), Satish Pai (Managing Director), and several independent and non-executive directors, such as Rajashree Birla and Alka Bharucha, who collectively guide the company's strategic direction. Geetika Anand serves as the Company Secretary and Compliance Officer.

The management team of Hindalco Industries includes the following key members:<BR><BR>1. **Kumar Mangalam Birla** - Chairman (Non-Executive)<BR>2. **Rajashree Birla** - Non-Executive Director<BR>3. **Alka Bharucha** - Independent Non-Executive Director<BR>4. **Anant Maheshwari** - Independent Non-Executive Director<BR>5. **A K Agarwala** - Non-Executive Director<BR>6. **K N Bhandari** - Independent Non-Executive Director<BR>7. **Praveen Kumar Maheshwari** - Executive Director / Whole Time Director<BR>8. **Satish Pai** - Executive Director & Managing Director<BR>9. **Sudhir Mital** - Independent Non-Executive Director<BR>10. **Vikas Balia** - Independent Non-Executive Director<BR>11. **Y P Dandiwala** - Independent Non-Executive Director<BR>12. **Geetika Anand** - Company Secretary & Compliance Officer<BR><BR>This team plays a crucial role in guiding the company's strategic direction and operations.

View full answer

What does Hindalco Inds. do?

01-Sep-2026

Hindalco Industries Ltd is the world's largest aluminium rolling and recycling company and a major player in copper, with significant operations in primary aluminium production. As of June 2026, it reported net sales of ₹84,825 Cr and a net profit of ₹7,013 Cr, with a market cap of ₹226,970 Cr.

Overview:<BR>Hindalco Industries Ltd is the world's largest aluminium rolling and recycling company, a major player in copper, and one of Asia's largest producers of primary aluminium, operating within the Non-Ferrous Metals industry and categorized as a Large Cap company.<BR><BR>History:<BR>Hindalco Industries Ltd was incorporated in the year N/A. The latest quarterly results reported are for June 2026, showing net sales and profit figures.<BR><BR>Financial Snapshot:<BR>Net Sales: 84,825 Cr (Quarterly Results - Jun 2026) <BR>Net Profit: 7,013 Cr (Quarterly Results - Jun 2026) <BR>Market Cap: INR 226,970 Cr (Large Cap)<BR><BR>Key Metrics:<BR>P/E: 10.00 <BR>Industry P/E: 12 <BR>Dividend Yield: 0.48% <BR>Debt-Equity: 0.56 <BR>Return on Equity: 13.58% <BR>Price to Book: 1.71 <BR><BR>Contact Details:<BR>Address: Ahura Centre 1st Floor B Wing, Mahakali Caves Road Andheri(E) Mumbai Maharashtra : 400093 <BR>Tel: 91-22-66917000 <BR>Email: anil.malik@adityabirla.com <BR>Website: http://www.hindalco.com

View full answer

Who are the peers of the Hindalco Inds.?

01-Sep-2026

Hindalco Inds. peers include Hindustan Zinc, Vedanta, National Aluminium, Hindustan Copper, Lloyds Enterprises, Dec. Gold Mines, and Pondy Oxides. Key metrics show varying management risks, growth ratings, and returns, with Hindustan Copper leading in 1-year return at 128.70%, while Hindalco Inds. has a 1-year return of 44.39%.

Peers: The peers of Hindalco Inds. are Hindustan Zinc, Vedanta, Natl. Aluminium, Hindustan Copper, Lloyds Enterpris, Dec.Gold Mines, and Pondy Oxides.<BR><BR>Quality Snapshot: Excellent management risk is observed at Vedanta and Natl. Aluminium, while Good management risk is found at Hindustan Zinc, Hindustan Copper, and Pondy Oxides, and Average management risk is seen at Lloyds Enterpris. Growth is rated as Excellent for Hindalco Inds., Lloyds Enterpris, and Pondy Oxides, while Average growth is noted for Hindustan Zinc, and Good growth is found at Natl. Aluminium and Hindustan Copper, and the rest. Capital Structure is Excellent for Natl. Aluminium and Hindustan Copper, Good for Hindalco Inds. and Vedanta, and the rest have varying ratings.<BR><BR>Return Snapshot: The peer with the highest 1-year return is Hindustan Copper at 128.70%, while Dec.Gold Mines has the lowest at 95.81%. Hindalco Inds. has a 1-year return of 44.39%, which is lower than both. Additionally, the six-month return is negative for Hindustan Zinc, Hindustan Copper, and Vedanta.

View full answer

How big is Hindalco Inds.?

01-Sep-2026

As of 31st August, Hindalco Industries Ltd has a market capitalization of 226,970.00 Cr, with recent net sales of 295,537.00 Cr and a net profit of 16,400.00 Cr.

As of 31st August, Hindalco Industries Ltd has a market capitalization of 226,970.00 Cr, categorizing it as a Large Cap company.<BR><BR>For the latest four quarters, the company reported Net Sales of 295,537.00 Cr and a Net Profit of 16,400.00 Cr.<BR><BR>The latest annual period for the balance sheet is March 2026, with Shareholder's Funds amounting to 136,583.00 Cr and Total Assets of 344,681.00 Cr.

View full answer

Should I buy, sell or hold Hindalco Industries Ltd?

08-Aug-2026

Are Hindalco Industries Ltd latest results good or bad?

23-May-2026

Hindalco Industries Ltd's latest results show strong sales growth with net sales increasing by 17.46% quarter-on-quarter, but net profit fell 50.84% year-on-year, raising concerns about operational efficiency and margin sustainability. While revenue growth is positive, the significant decline in profit suggests potential challenges ahead for the company.

Hindalco Industries Ltd's latest results present a mixed picture. On one hand, the company achieved a significant increase in net sales, which reached ₹78,133 crore, marking a 17.46% growth quarter-on-quarter and a 20.41% increase year-on-year. This reflects strong demand across both aluminium and copper segments and indicates robust top-line expansion.<BR><BR>However, the net profit for the quarter was ₹2,597 crore, which, despite being a 26.74% increase from the previous quarter, represents a concerning 50.84% decline compared to the same quarter last year. This sharp drop in profitability raises questions about the company's operational efficiency and the sustainability of its margins, especially given the compressed operating margin of 12.82%, down from 13.62% a year ago.<BR><BR>The financial performance highlights a strong revenue trajectory but is overshadowed by significant margin pressures and a dramatic year-on-year decline in profit. Overall, while the sales growth is commendable, the substantial decrease in net profit suggests that Hindalco is facing challenges that could impact its future performance. Investors may want to approach with caution, considering both the growth potential and the current profitability concerns.

View full answer

Is Hindalco Inds. technically bullish or bearish?

05-Dec-2025

As of December 4, 2025, Hindalco Inds. shows a mildly bullish trend with daily moving averages supporting upward momentum, but mixed signals from weekly and monthly indicators suggest a cautious outlook.

As of 4 December 2025, the technical trend for Hindalco Inds. has changed from bullish to mildly bullish. The current stance is mildly bullish, supported by the daily moving averages indicating bullish momentum. However, the weekly MACD is mildly bearish, which suggests some caution. The Bollinger Bands on both weekly and monthly time frames are bullish, indicating potential upward movement. The KST is bullish on a weekly basis but mildly bearish monthly, while the OBV shows a mildly bearish trend weekly. Overall, the mixed signals from different time frames indicate a cautious bullish outlook.

View full answer

Is Hindalco Inds. overvalued or undervalued?

19-Nov-2025

As of November 18, 2025, Hindalco Industries is considered an attractive investment with a PE ratio of 10.00, an EV to EBITDA of 6.87, and a PEG ratio of 0.27, indicating strong growth potential and outperforming the Sensex with a year-to-date return of 32.46%.

As of 18 November 2025, Hindalco Industries has moved from a very attractive to an attractive valuation grade. The company is currently considered undervalued based on its financial metrics. Key ratios include a PE ratio of 10.00, an EV to EBITDA of 6.87, and a PEG ratio of 0.27, which indicates strong growth potential relative to its price.<BR><BR>In comparison to its peers, Hindalco's PE ratio of 10.00 is higher than National Aluminium's 7.73 but significantly lower than Hardwyn India's 56.94, highlighting its competitive positioning within the industry. Additionally, its EV to EBITDA ratio is more favorable than the industry average, suggesting that it is trading at a reasonable valuation compared to its earnings potential. Notably, Hindalco has outperformed the Sensex over various periods, with a year-to-date return of 32.46% compared to the Sensex's 8.36%, reinforcing its attractiveness as an investment.

View full answer

How has been the historical performance of Hindalco Inds.?

12-Nov-2025

Hindalco Inds. has shown significant financial growth, with net sales reaching ₹2,38,496 Cr in Mar'25, up from ₹2,15,962 Cr in Mar'24, and profit after tax increasing to ₹15,999 Cr from ₹10,153 Cr. The company's earnings per share rose to 72.08, reflecting improved profitability and operational efficiency.

Answer:<BR>The historical performance of Hindalco Inds. shows significant growth in net sales and profit over the years, with net sales reaching 2,38,496.00 Cr in Mar'25, up from 2,15,962.00 Cr in Mar'24 and 2,23,202.00 Cr in Mar'23. The total operating income also reflects this upward trend, increasing to 2,38,496.00 Cr in Mar'25 from 2,15,962.00 Cr in Mar'24. Operating profit (PBDIT) rose to 34,513.00 Cr in Mar'25, compared to 25,368.00 Cr in Mar'24, indicating improved operational efficiency. Profit before tax surged to 22,334.00 Cr in Mar'25, up from 14,010.00 Cr in Mar'24, while profit after tax also increased to 15,999.00 Cr from 10,153.00 Cr in the previous year. The earnings per share (EPS) saw a notable rise to 72.08 in Mar'25 from 45.74 in Mar'24. On the balance sheet, total assets grew to 2,64,300.00 Cr in Mar'25 from 2,30,723.00 Cr in Mar'24, with total liabilities also increasing to 2,64,300.00 Cr. Cash flow from operating activities remained strong at 24,410.00 Cr in Mar'25, slightly up from 24,056.00 Cr in Mar'24, although net cash outflow was recorded at -2,015.00 Cr in Mar'25.<BR><BR>Breakdown:<BR>Hindalco Inds. has demonstrated a robust growth trajectory in its financial performance over recent years. The net sales have consistently increased, culminating in 2,38,496.00 Cr in Mar'25, reflecting a strong demand for its products. The total operating income mirrored this growth, indicating effective revenue generation strategies. Operating profit (PBDIT) also saw a significant rise, suggesting enhanced operational efficiency and cost management. The profit before tax and profit after tax figures further underscore the company's profitability, with substantial increases year-on-year. The earnings per share have improved markedly, showcasing better returns for shareholders. On the balance sheet, total assets and liabilities have both risen, indicating expansion and investment in growth. The cash flow from operating activities remains healthy, although the company faced a net cash outflow, which may require attention in future financial planning. Overall, Hindalco Inds. has shown resilience and growth in its financial metrics, positioning itself favorably in the market.

View full answer

Who are the top shareholders of the Hindalco Inds.?

17-Jul-2025

The top shareholders of Hindalco Industries include Igh Holdings Private Limited with 15.58%, foreign institutional investors at 28.14%, and mutual funds holding 13.29%. Individual investors own about 5.3%, while the highest public shareholder is Lici Asm Non Par at 5.03%.

The top shareholders of Hindalco Industries include a mix of promoters, institutional investors, and individual shareholders. The largest promoter is Igh Holdings Private Limited, which holds 15.58% of the shares. <BR><BR>In terms of institutional ownership, mutual funds collectively hold 13.29% across 48 schemes, while foreign institutional investors (FIIs) own 28.14% through 1009 different entities. The highest public shareholder is Lici Asm Non Par, with a holding of 5.03%. Individual investors account for approximately 5.3% of the total shares. <BR><BR>Overall, the majority of the shares are held by promoters, with no pledged promoter holdings reported.

View full answer

When is the next results date for Hindalco Inds.?

06-Jun-2025

No Upcoming Board Meetings

Has Hindalco Inds. declared dividend?

06-Jun-2025

Hindalco Industries Ltd has declared a 350% dividend, amounting to ₹3.5 per share, with an ex-date of August 9, 2024. While recent total returns have been negative over the last 6 months and year, the company has shown strong positive returns over the longer term, particularly a total return of 342.46% over the past 5 years.

Hindalco Industries Ltd has declared a 350% dividend.<BR><BR>Dividend Details:<BR>- Percentage announced: 350%<BR>- Amount per share: 3.5<BR>- Ex-date: 09 Aug 24<BR><BR>Dividend Yield: 0.55%<BR><BR>Total Returns by Period:<BR>In the last 6 months, the price return was -3.47%, the dividend return was 0%, resulting in a total return of -3.47%.<BR><BR>Over the past year, the price return was -4.51%, the dividend return was 0.52%, leading to a total return of -3.99%.<BR><BR>In the 2-year period, the price return was 55.78%, the dividend return was 1.52%, culminating in a total return of 57.3%.<BR><BR>For the 3-year period, the price return was 58.08%, the dividend return was 3.32%, which resulted in a total return of 61.4%.<BR><BR>In the last 4 years, the price return was 63.72%, the dividend return was 3.53%, giving a total return of 67.25%.<BR><BR>Finally, over the past 5 years, the price return was 333.32%, the dividend return was 9.14%, resulting in a total return of 342.46%.<BR><BR>Overall, Hindalco has declared a significant dividend while experiencing varying total returns across different periods, with positive returns in the longer term, particularly over the last 5 years.

View full answer
iScoreScore
Part of MojoOne Strategy
Click here to find our call on this stock
Strong Sell
Sell
Hold
Buy
Strong Buy

Dashboard

1

Company has a Debt to Equity ratio (avg) of 0.45 times

 
2

Healthy long term growth as Net Sales has grown by an annual rate of 14.82% and Operating profit at 16.16%

 
3

With a growth in Net Profit of 169.4%, the company declared Very Positive results in Jun 26

4

With ROCE of 12.2, it has a Attractive valuation with a 1.4 Enterprise value to Capital Employed

5

High Institutional Holdings at 55.77%

stock-summaryMojo Parameters

Mojo Parameters

Loading Valuation Snapshot...

Stock DNA

stock-summary
Industry

Non - Ferrous Metals

stock-summary
Market cap

INR 222,745 Cr (Large Cap)

stock-summary
P/E

9.00

stock-summary
Industry P/E

11

stock-summary
Dividend Yield

0.51%

stock-summary
Debt Equity

0.56

stock-summary
Return on Equity

13.58%

stock-summary
Price to Book

1.62

Revenue and Profits:
Net Sales:
84,825 Cr
(Quarterly Results - Jun 2026)
Net Profit:
7,013 Cr
stock-summaryTotal Returns
Total Returns (Price + Dividend) stock-summary
Dividend Yield (0.51%)
TimePeriod
Price Return
Dividend Return
Total Return
3 Months
-3.64%
0.49%
-3.15%
6 Months
4.1%
0.59%
4.69%
1 Year
29.63%
0.67%
30.3%
2 Years
41.88%
1.32%
43.2%
3 Years
100.81%
2.86%
103.67%
4 Years
134.75%
4.16%
138.91%
5 Years
105.5%
3.78%
109.28%

Latest dividend: 5 per share ex-dividend date: Jul-10-2026

Risk Adjusted Returns v/s stock-summary
Returns Beta
Icon
Beta has not been calculated since enough price history is not available
stock-summaryNews & Corporate Actions

News

Hindalco Industries Ltd’s Mixed Week: -1.01% Price Change Amid Technical Shifts and Strong Fundamentals

Key Events This Week

15 Sep: Technical momentum shifts amid mixed indicator signals

16 Sep: Downgrade from Strong Buy to Buy by MarketsMOJO

18 Sep: Robust value trading with high volume despite mixed technicals

Weekly Close: Rs.972.00 (-1.01%) vs Sensex -0.41%

P/E at 9.5 vs Industry's 10.61: What the Data Shows for Hindalco Industries Ltd

Valuation Picture: Modest Discount Amid Sector Dynamics

Hindalco Industries Ltd trades at a P/E of 9.5, which is approximately 10.5% below the Non - Ferrous Metals industry average of 10.61. This valuation discount suggests the market is pricing in either sector-specific headwinds or company-specific risks relative to peers. Given the stock’s large-cap status with a market capitalisation of ₹2,21,576.54 crores, this premium or discount carries significant weight in investor sentiment. The sector’s average P/E reflects a moderate valuation environment, and Hindalco<...

Read full news article

Announcements stock-summary

Disclosure Regarding ESG Rating Under Regulation 30 Of SEBI (Listing Obligations And Disclosure Requirements) Regulations 2015

18-Sep-2026 | Source : BSE

Disclosure regarding ESG Rating of the Company.

Announcement under Regulation 30 (LODR)-Analyst / Investor Meet - Intimation

11-Sep-2026 | Source : BSE

Intimation regarding investor meeting at the CITIC CLSA 33rd Investors Forum 2026 to be attended by Companys Representatives

Announcement under Regulation 30 (LODR)-Newspaper Publication

11-Sep-2026 | Source : BSE

Newspaper Advertisement(s) regarding Notice of Special Window for Re-lodgement of Transfer Requests of Physical Shares

Corporate Actions stock-summary

stock-summary
BOARD MEETING

No Upcoming Board Meetings

stock-summary
DIVIDEND

Hindalco Industries Ltd has declared 500% dividend, ex-date: 10 Jul 26

stock-summary
SPLITS

No Splits history available

stock-summary
BONUS

No Bonus history available

stock-summary
RIGHTS

Hindalco Industries Ltd has announced 3:7 rights issue, ex-date: 28 Aug 08

stock-summaryKey Factors

Quality key factors stock-summary

Factor
Value
Sales Growth (5y)
14.82%
EBIT Growth (5y)
16.16%
EBIT to Interest (avg)
6.08
Debt to EBITDA (avg)
2.47
Net Debt to Equity (avg)
0.56
Sales to Capital Employed (avg)
1.30
Tax Ratio
26.17%
Dividend Payout Ratio
6.94%
Pledged Shares
0
Institutional Holding
55.77%
ROCE (avg)
13.25%
ROE (avg)
12.89%

Valuation key factors

Factor
Value
P/E Ratio
9
Industry P/E
11
Price to Book Value
1.60
EV to EBIT
9.27
EV to EBITDA
7.21
EV to Capital Employed
1.38
EV to Sales
1.00
PEG Ratio
0.27
Dividend Yield
0.51%
ROCE (Latest)
12.23%
ROE (Latest)
13.58%

Technicals key factors

Indicator
Weekly
Monthly
MACD
Mildly Bearish
Bullish
RSI
No Signal
No Signal
Bollinger Bands
Bearish
Mildly Bullish
Moving Averages
Mildly Bullish (Daily)
KST
Bearish
Bullish
Dow Theory
Mildly Bearish
Mildly Bullish
OBV
Mildly Bullish
Mildly Bullish
stock-summary Technical Indicator Scale: Bearish, Mildly Bearish, Sideways, Mildly Bullish, Bullish  Turned 
stock-summaryShareholding
Shareholding Snapshot : Jun 2026stock-summary
Shareholding Compare (%holding) stock-summary
Majority shareholders

Promoters

Pledged Promoter Holdings

None

Mutual Funds

Held by 53 Schemes (10.05%)

FIIs

Held by 1117 FIIs (31.42%)

Promoter with highest holding

Igh Holdings Private Limited (15.58%)

Highest Public shareholder

Life Insurance Corporation Of India (4.59%)

Individual Investors Holdings

5.67%

stock-summaryFinancial
[
  {
    "link": "quarterly",
    "btn_text": "All Quarterly Results",
    "header": "Quarterly Results Snapshot (Consolidated) - Jun'26 - QoQ",
    "rhs": [
      {
        "prefix": "Net Sales ",
        "suffix": "QoQ Growth in quarter ended Jun 2026 is 8.56% vs 17.46% in Mar 2026",
        "dir": -1
      },
      {
        "prefix": "Consolidated Net Profit ",
        "suffix": "QoQ Growth in quarter ended Jun 2026 is 170.04% vs 26.74% in Mar 2026",
        "dir": 1
      }
    ],
    "table": {
      "header": [
        "Jun'26",
        "Mar'26",
        "Change(%)"
      ],
      "body": [
        {
          "field": "Net Sales",
          "val1": "84,825.00",
          "val2": "78,133.00",
          "chgp": "8.56%",
          "chgp_class": "positive"
        },
        {
          "field": "Operating Profit (PBDIT) excl Other Income",
          "val1": "13,932.00",
          "val2": "10,018.00",
          "chgp": "39.07%",
          "chgp_class": "positive"
        },
        {
          "field": "Interest",
          "val1": "966.00",
          "val2": "1,042.00",
          "chgp": "-7.29%",
          "chgp_class": "positive"
        },
        {
          "field": "Exceptional Items",
          "val1": "-2,299.00",
          "val2": "-4,171.00",
          "chgp": "44.88%",
          "chgp_class": "positive"
        },
        {
          "field": "Consolidate Net Profit",
          "val1": "7,013.00",
          "val2": "2,597.00",
          "chgp": "170.04%",
          "chgp_class": "positive"
        },
        {
          "field": "Operating Profit Margin (Excl OI)",
          "val1": "16.42%",
          "val2": "12.82%",
          "chgp": "3.60%",
          "chgp_class": "positive"
        }
      ]
    }
  },
  {
    "link": "half-yearly",
    "btn_text": "All Half Yearly Results",
    "header": "Half Yearly Results Snapshot (Consolidated) - Sep'25",
    "rhs": [
      {
        "prefix": "Net Sales ",
        "suffix": " Growth in half year ended Sep 2025 is 13.08% vs 7.52% in Sep 2024",
        "dir": 1
      },
      {
        "prefix": "Consolidated Net Profit ",
        "suffix": " Growth in half year ended Sep 2025 is 25.23% vs 50.17% in Sep 2024",
        "dir": -1
      }
    ],
    "table": {
      "header": [
        "Sep'25",
        "Sep'24",
        "Change(%)"
      ],
      "body": [
        {
          "field": "Net Sales",
          "val1": "1,30,290.00",
          "val2": "1,15,216.00",
          "chgp": "13.08%",
          "chgp_class": "positive"
        },
        {
          "field": "Operating Profit (PBDIT) excl Other Income",
          "val1": "16,872.00",
          "val2": "15,386.00",
          "chgp": "9.66%",
          "chgp_class": "positive"
        },
        {
          "field": "Interest",
          "val1": "1,557.00",
          "val2": "1,728.00",
          "chgp": "-9.90%",
          "chgp_class": "positive"
        },
        {
          "field": "Exceptional Items",
          "val1": "-182.00",
          "val2": "-844.00",
          "chgp": "78.44%",
          "chgp_class": "positive"
        },
        {
          "field": "Consolidate Net Profit",
          "val1": "8,745.00",
          "val2": "6,983.00",
          "chgp": "25.23%",
          "chgp_class": "positive"
        },
        {
          "field": "Operating Profit Margin (Excl OI)",
          "val1": "12.95%",
          "val2": "13.35%",
          "chgp": "-0.40%",
          "chgp_class": "negative"
        }
      ]
    }
  },
  {
    "link": "nine-monthly",
    "btn_text": "All Nine Monthly Results",
    "header": "Nine Monthly Results Snapshot (Consolidated) - Dec'25",
    "rhs": [
      {
        "prefix": "Net Sales ",
        "suffix": "YoY Growth in nine months ended Dec 2025 is 13.37% vs 8.53% in Dec 2024",
        "dir": 1
      },
      {
        "prefix": "Consolidated Net Profit ",
        "suffix": "YoY Growth in nine months ended Dec 2025 is 0.71% vs 53.53% in Dec 2024",
        "dir": -1
      }
    ],
    "table": {
      "header": [
        "Dec'25",
        "Dec'24",
        "Change(%)"
      ],
      "body": [
        {
          "field": "Net Sales",
          "val1": "1,96,811.00",
          "val2": "1,73,606.00",
          "chgp": "13.37%",
          "chgp_class": "positive"
        },
        {
          "field": "Operating Profit (PBDIT) excl Other Income",
          "val1": "24,866.00",
          "val2": "22,969.00",
          "chgp": "8.26%",
          "chgp_class": "positive"
        },
        {
          "field": "Interest",
          "val1": "2,438.00",
          "val2": "2,545.00",
          "chgp": "-4.20%",
          "chgp_class": "positive"
        },
        {
          "field": "Exceptional Items",
          "val1": "-2,792.00",
          "val2": "-885.00",
          "chgp": "-215.48%",
          "chgp_class": "negative"
        },
        {
          "field": "Consolidate Net Profit",
          "val1": "10,794.00",
          "val2": "10,718.00",
          "chgp": "0.71%",
          "chgp_class": "positive"
        },
        {
          "field": "Operating Profit Margin (Excl OI)",
          "val1": "12.63%",
          "val2": "13.23%",
          "chgp": "-0.60%",
          "chgp_class": "negative"
        }
      ]
    }
  },
  {
    "link": "annual",
    "btn_text": "All Annual Results",
    "header": "Annual Results Snapshot (Consolidated) - Mar'26",
    "rhs": [
      {
        "prefix": "Net Sales ",
        "suffix": "YoY Growth in year ended Mar 2026 is 15.28% vs 10.43% in Mar 2025",
        "dir": 1
      },
      {
        "prefix": "Consolidated Net Profit ",
        "suffix": "YoY Growth in year ended Mar 2026 is -16.31% vs 57.57% in Mar 2025",
        "dir": -1
      }
    ],
    "table": {
      "header": [
        "Mar'26",
        "Mar'25",
        "Change(%)"
      ],
      "body": [
        {
          "field": "Net Sales",
          "val1": "2,74,944.00",
          "val2": "2,38,496.00",
          "chgp": "15.28%",
          "chgp_class": "positive"
        },
        {
          "field": "Operating Profit (PBDIT) excl Other Income",
          "val1": "34,884.00",
          "val2": "31,805.00",
          "chgp": "9.68%",
          "chgp_class": "positive"
        },
        {
          "field": "Interest",
          "val1": "3,480.00",
          "val2": "3,419.00",
          "chgp": "1.78%",
          "chgp_class": "negative"
        },
        {
          "field": "Exceptional Items",
          "val1": "-6,963.00",
          "val2": "-879.00",
          "chgp": "-692.15%",
          "chgp_class": "negative"
        },
        {
          "field": "Consolidate Net Profit",
          "val1": "13,391.00",
          "val2": "16,001.00",
          "chgp": "-16.31%",
          "chgp_class": "negative"
        },
        {
          "field": "Operating Profit Margin (Excl OI)",
          "val1": "12.69%",
          "val2": "13.34%",
          "chgp": "-0.65%",
          "chgp_class": "negative"
        }
      ]
    }
  }
]

Quarterly Results Snapshot (Consolidated) - Jun'26 - QoQstock-summary

Jun'26
Mar'26
Change(%)
Net Sales
84,825.00
78,133.00
8.56%
Operating Profit (PBDIT) excl Other Income
13,932.00
10,018.00
39.07%
Interest
966.00
1,042.00
-7.29%
Exceptional Items
-2,299.00
-4,171.00
44.88%
Consolidate Net Profit
7,013.00
2,597.00
170.04%
Operating Profit Margin (Excl OI)
16.42%
12.82%
3.60%
Values in Rs Cr.
Direction Arrows
Net Sales

QoQ Growth in quarter ended Jun 2026 is 8.56% vs 17.46% in Mar 2026

Direction Arrows
Consolidated Net Profit

QoQ Growth in quarter ended Jun 2026 is 170.04% vs 26.74% in Mar 2026

Half Yearly Results Snapshot (Consolidated) - Sep'25stock-summary

Sep'25
Sep'24
Change(%)
Net Sales
1,30,290.00
1,15,216.00
13.08%
Operating Profit (PBDIT) excl Other Income
16,872.00
15,386.00
9.66%
Interest
1,557.00
1,728.00
-9.90%
Exceptional Items
-182.00
-844.00
78.44%
Consolidate Net Profit
8,745.00
6,983.00
25.23%
Operating Profit Margin (Excl OI)
12.95%
13.35%
-0.40%
Values in Rs Cr.
Direction Arrows
Net Sales

Growth in half year ended Sep 2025 is 13.08% vs 7.52% in Sep 2024

Direction Arrows
Consolidated Net Profit

Growth in half year ended Sep 2025 is 25.23% vs 50.17% in Sep 2024

Nine Monthly Results Snapshot (Consolidated) - Dec'25stock-summary

Dec'25
Dec'24
Change(%)
Net Sales
1,96,811.00
1,73,606.00
13.37%
Operating Profit (PBDIT) excl Other Income
24,866.00
22,969.00
8.26%
Interest
2,438.00
2,545.00
-4.20%
Exceptional Items
-2,792.00
-885.00
-215.48%
Consolidate Net Profit
10,794.00
10,718.00
0.71%
Operating Profit Margin (Excl OI)
12.63%
13.23%
-0.60%
Values in Rs Cr.
Direction Arrows
Net Sales

YoY Growth in nine months ended Dec 2025 is 13.37% vs 8.53% in Dec 2024

Direction Arrows
Consolidated Net Profit

YoY Growth in nine months ended Dec 2025 is 0.71% vs 53.53% in Dec 2024

Annual Results Snapshot (Consolidated) - Mar'26stock-summary

Mar'26
Mar'25
Change(%)
Net Sales
2,74,944.00
2,38,496.00
15.28%
Operating Profit (PBDIT) excl Other Income
34,884.00
31,805.00
9.68%
Interest
3,480.00
3,419.00
1.78%
Exceptional Items
-6,963.00
-879.00
-692.15%
Consolidate Net Profit
13,391.00
16,001.00
-16.31%
Operating Profit Margin (Excl OI)
12.69%
13.34%
-0.65%
Values in Rs Cr.
Direction Arrows
Net Sales

YoY Growth in year ended Mar 2026 is 15.28% vs 10.43% in Mar 2025

Direction Arrows
Consolidated Net Profit

YoY Growth in year ended Mar 2026 is -16.31% vs 57.57% in Mar 2025

stock-summaryCompany CV
About Hindalco Industries Ltd stock-summary
stock-summary
Hindalco Industries Ltd
Large Cap
Non - Ferrous Metals
Hindalco Industries Limited, the metals flagship of the Aditya Birla Group, is the world's largest aluminium rolling and recycling company, a major copper player, and one of Asia's largest producers of primary aluminium. In India, Hindalco's aluminium manufacturing units cover the complete value chain, from bauxite mining, alumina refining, coal mining, captive power generation and aluminium smelting, to downstream value-addition of aluminium rolling, extruding, and foil making.
Company Coordinates stock-summary
Company Details
Ahura Centre 1st Floor B Wing, Mahakali Caves Road Andheri(E) Mumbai Maharashtra : 400093
stock-summary
Tel: 91-22-66917000
stock-summary
anil.malik@adityabirla.com
Registrar Details
Hindalco Industries Ltd , Century Bhavan 3rd Floor, Dr Annie Besant Road Worli, Mumbai